If data is normally distributed, it is represented by a bell-shaped curve. Normal distributions are common in nature and statistics, like heights or test scores. Understanding this distribution helps us make predictions and compare data from different sources easily.
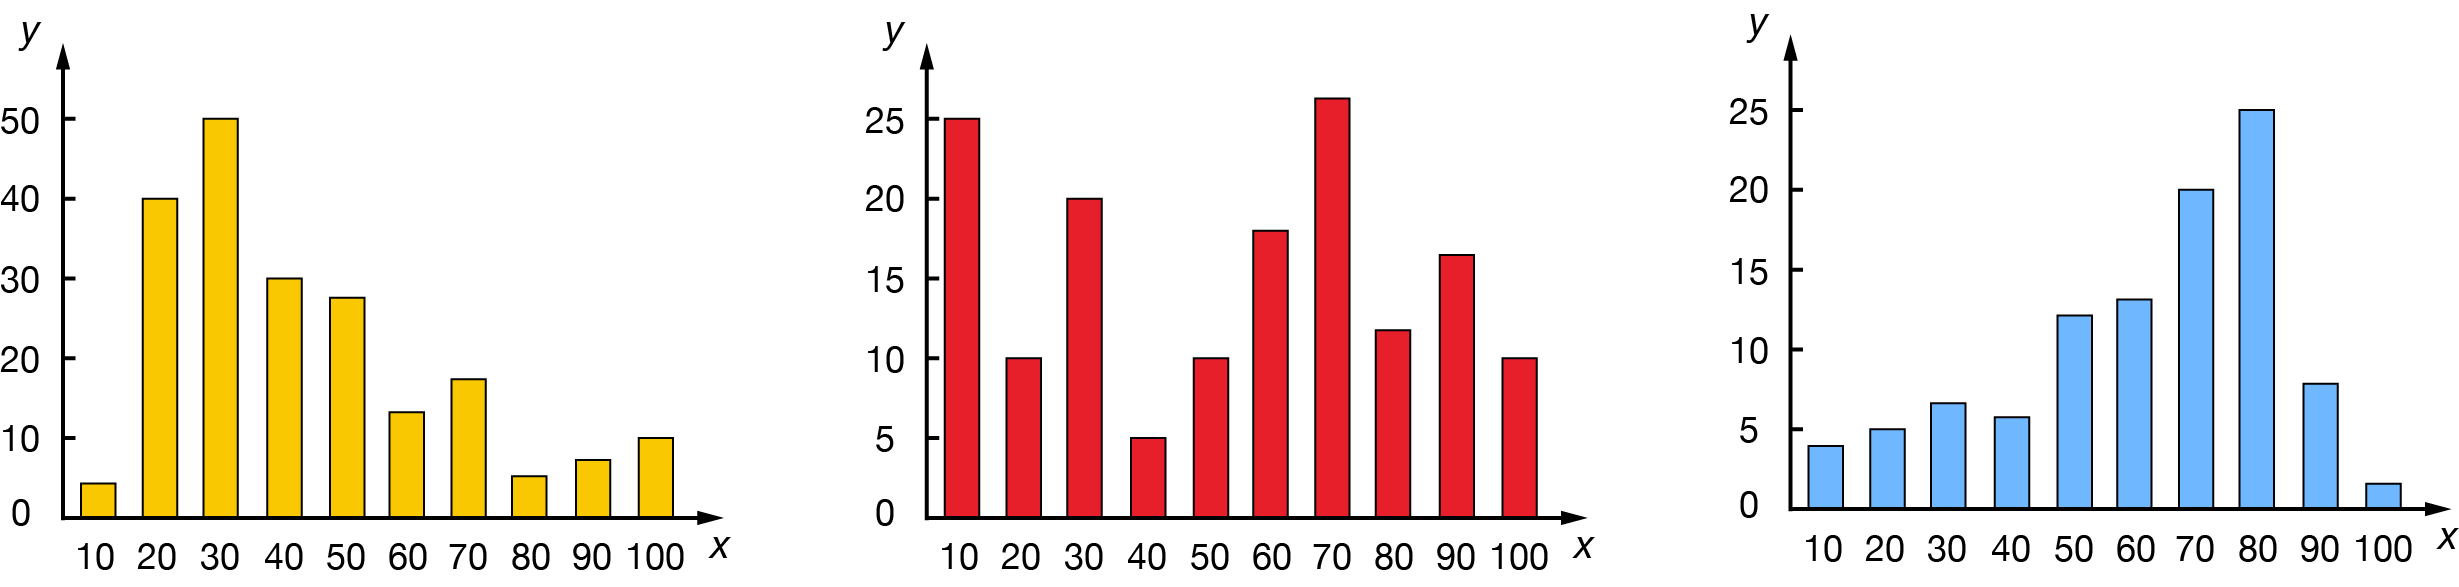
Graphical representations of data may look quite different.
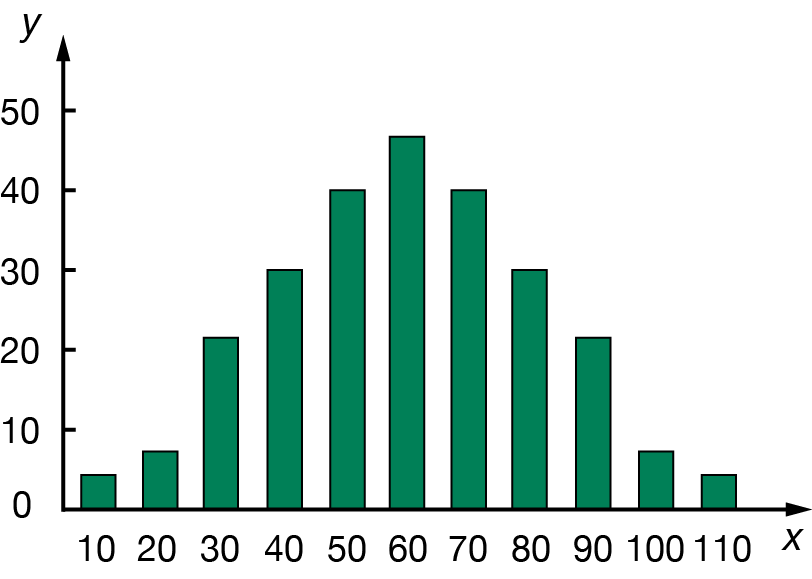
Many things that we can measure follow a bell-shaped curve, such as
heights of people
blood pressure
errors in measurement
scores on a test
Such data produces a normal distribution. A normal distribution curve shows that most data points cluster around the middle, or mean, with fewer points appearing as you move away from the centre.
Properties of a normal distribution
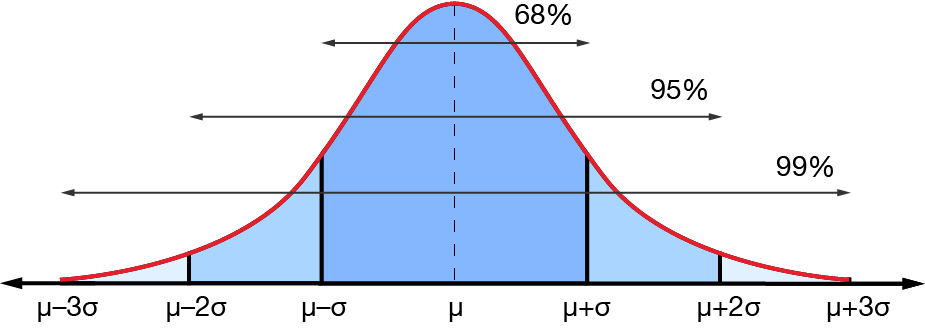
In a normal distribution curve:
there is symmetry about the mean
the mean = median = mode
\(50\%\) of values are greater than the mean and \(50\%\) are less than the mean
\(68\%\) of values fall within one standard deviation either side of the mean (approximately)
\(95\%\) of values fall within two standard deviations either side of the mean (approximately)
\(99.7\%\) of values fall within three standard deviation either side of the mean (approximately).
Remember the \(68-95-99\) rule.
Even though most of the data will fall within three standard deviations of the mean, there is in theory, no upper or lower bound to a normal distribution. We are just less and less likely to find values beyond these points.
Example – analysing normal distributions
If scores on an IQ test are normally distributed with a mean of \(\mu=100\) and standard deviation of \(\sigma=10\), what percentage of people would you expect to:
score between \(90\) and \(110\)?
score less than \(80\)?
The values \(90\) and \(110\) are \(10\) away from the mean. This is one standard deviation away. Therefore, you would expect \(68\%\) of people to score between \(90\) and \(110\).
\(80\) is \(20\) away from the mean. This is two standard deviations away. We know that \(95\%\) of the scores fall between two standard deviations of the mean, so \(5\%\) must fall outside of this range. This \(5\%\) would include scores two standard deviations below the mean \((<80)\) and two standard deviations above the mean \((>120)\), so half of this percentage would score less than \(80\), i.e. \(2.5\%\).
Exercise – analysing normal distributions
Scores on a general achievement test are normally distributed with a mean of \(80\) and a standard deviation of \(15\). Adam scored \(95\). What proportion of students had a higher score than Adam?
The actual weights of cereal boxes that are supposed to contain \(500\textrm{ g}\) are normally distributed with mean of \(510\textrm{ g}\) and a standard deviation of \(5\textrm{ g}\). What proportion of boxes are under-filled?
In a Maths class, the bottom \(16\%\) of students are given an F grade. If the class mean is \(63\) and the standard deviation is \(18\), what score must a student get to pass?
If newborn birth weights in a certain hospital are normally distributed with a mean of \(3200\textrm{ g}\) and a standard deviation of \(400\textrm{ g}\):
what percentage of babies weigh more than \(3200\textrm{ g}\)?
what percentage of babies weigh between \(2400\textrm{ g}\) and \(4000\textrm{ g}\)?
what percentage of babies weigh less than \(3600\textrm{ g}\)?
if the \(16\%\) of babies with the lowest birth weights are placed in the special care nursery, will a baby that weighs \(2500\textrm{ g}\) need special care?
\(95\%\) of people in a clinical study had systolic blood pressure readings between \(116\) and \(144\). If the blood pressure measurements follow a normal distribution, what is the mean and standard deviation of the blood pressures for this group?
A class of ten students get the following marks in a test: \(13,23,41,55,66,78,49,33,35,67\). If anyone who scored less than one standard deviation below the mean fails, how many students will fail?