As well as comparing the test statistic to a critical value, we can test hypotheses by comparing a p-value to the significance level, \(\alpha\). Understanding p-values helps us decide if our results are meaningful or just due to random chance. Use this resource to learn how to use p-values.
In hypothesis testing, there are two ways for us to make a decision about the null hypothesis. So far, we have compared the test statistic with the critical value/s and asked the question: Is the test statistic more extreme than the critical value?
If yes, we reject the null hypothesis.
If no, we do not reject the null hypothesis.
The other approach is to calculate the p-value and compare it with \(\alpha\).
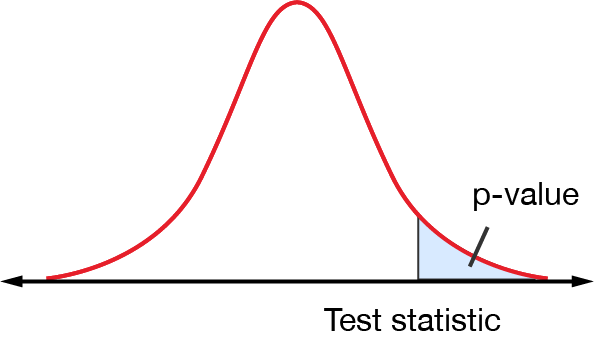
The p-value is a probability. It is a measure of the likelihood of the test statistic being obtained if the null hypothesis is true. If the probability is lower than \(\alpha\), we reject the null hypothesis. Our question becomes: Is \(p<\alpha\)?
If yes, we reject the null hypothesis.
If no, we do not reject the null hypothesis.
Calculating p-values
The p-value differs depending on whether we are looking at a two-tailed or one-tailed test.
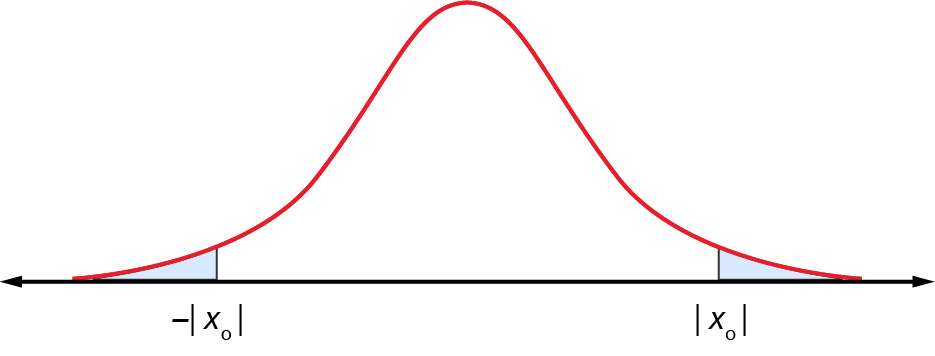
p-values in two-tailed tests
For a two-tailed test where \(x_{o}\) is the test statistic, the p-value is the sum of the areas of the two regions beyond \(-\left|x_{o}\right|\) and \(\left|x_{o}\right|\).
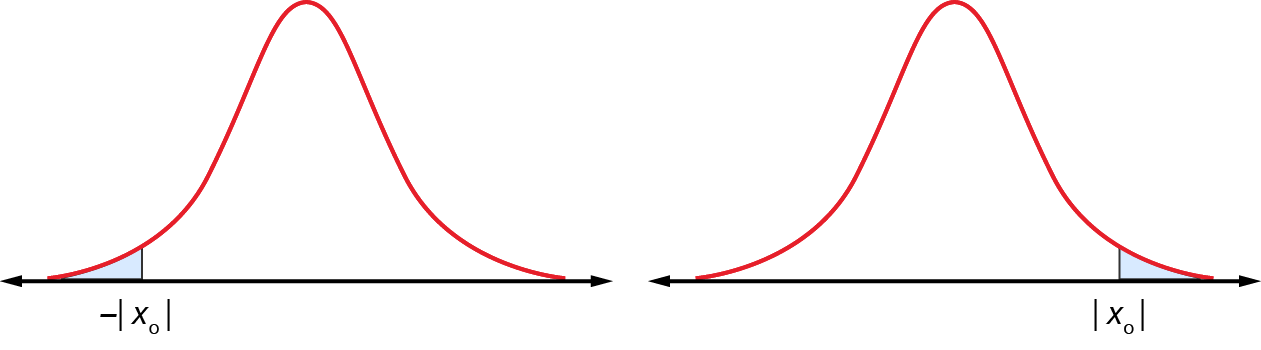
p-values in one-tailed tests
For a one-tailed test where \(x_{o}\) is the test statistic, the p-value is either the area to the left of \(x_{o}\) for a left-sided test, or the area to the right of \(x_{o}\) for a right-sided test.
Using p-values
The steps for a hypothesis test using the p-value are:
State the null and alternative hypotheses.
Choose the level of significance, \(\alpha\).
Calculate the test statistic.
Find the p-value of the test statistic. This number is obtained from a graphics calculator or an online tool like Stat Trek.
Decide whether to reject the null hypothesis by comparing the p-value to \(\alpha\).
State your conclusion.
Example – using p-values
The student queries service at a university claim that during orientation week, the average wait time to be seen is \(23\) minutes. However, this has been disputed, as feedback from student focus groups indicates the wait is much longer.
To test the hypothesis, the wait time for \(40\) randomly selected students is recorded during the next orientation week. The average wait time is found to be \(25\) minutes with a standard deviation of \(5\) minutes. Is there evidence to support the hypothesis that the average wait time exceeds \(23\) minutes at a \(5\)% level of significance?
Hypotheses:
\(H_{0}:\mu=23\)
\(H_{a}:\mu>23\)
Significance level: \(\alpha=0.05\)
The population standard deviation is unknown, so we use a t-test. The test statistic, \(t\) is:
\[\begin{align*} t & = \frac{\overline{x}-\mu}{s_{\overline{x}}}\\
& = \frac{25-23}{\frac{5}{\sqrt{40}}}\\
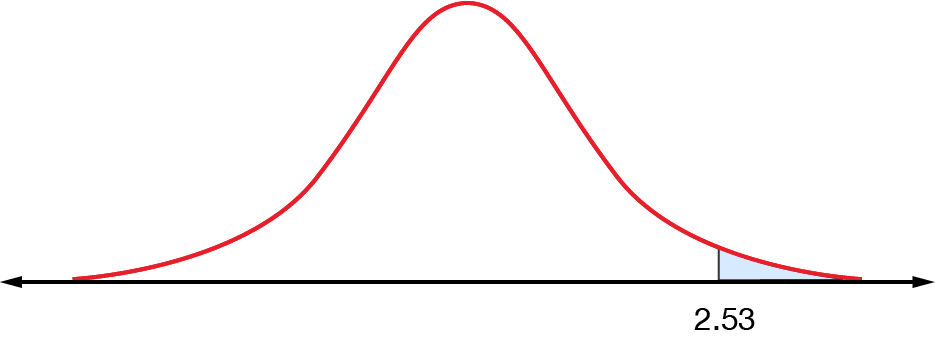
& = 2.53
\end{align*}\]
The p-value is the area to the right of \(2.53\). We are looking at a right-tailed test because we want to know if the sample mean is greater than the claimed mean.
The area is \(0.0078\).
To make a decision, we check if \(p<\alpha\). \(0.0078<0.05\), so we reject the null hypothesis.
There is evidence to suggest that the average wait time for student queries during orientation week is more than \(23\) minutes.
Exercise – using p-values
A sample of \(10\) is drawn from a normally distributed population and the mean is found to be \(37.22\). Use the p-value method to see if the sample mean is significantly less than the population mean of \(40\). The population standard deviation is known to be \(3.27\). Use \(\alpha=0.05\).
Traditionally, it is believed that \(35\%\) of RMIT students are aware of the SLC Maths drop-in service. Management have recently implemented a new marketing strategy and results of a new survey show that out of the \(100\) randomly sampled students, \(42\) knew of the service.
Is there evidence to suggest that the proportion of students at RMIT who are aware of the Maths drop-in service has changed after the implementation of the marketing initiative? Use \(\alpha=0.1\) with the p-value method.
The manufacturer of Branbix cereal claims the mean weight of contents of each box is \(450\textrm{ g}\). A consumer interest magazine weighs a sample of \(100\) boxes and finds that they have a mean of \(444\textrm{ g}\) with a standard deviation of \(28\textrm{ g}\).
Use the p-value method to decide whether the sample data contradicts the manufacturers and the boxes are being underfilled? Use \(\alpha=0.01\).
The university is considering opening an evening Maths drop-in service, but only on the condition that attendance would be at least \(20\%\) of the weekly daytime average. A random survey of \(400\) attendees indicated that \(92\) would attend in the evening. Use the p-value method \((\alpha=0.1)\) to decide what the drop-in service should do.
\(z=-2.69\) and \(p=0.0037\). \(p<0.05\), so we reject the null hypothesis. There is enough evidence to suggest that the sample mean is significantly less than the population mean of \(40\).
\(z=\pm1.47\) and \(p=0.142\). \(p>0.1\), so we do not reject the null hypothesis. There is not enough evidence to suggest that the proportion of RMIT students who are aware of the Maths drop-in service has changed following implementation of the marketing initiative.
\(t=-2.14\) and \(p=0.017\). \(p>0.01\), so we do not reject the null hypothesis. There is not enough evidence to suggest that the Branbix cereal boxes are being underfilled.
\(z=1.5\) and \(p=0.0668\). \(p<0.1\), so we reject the null hypothesis. There is enough evidence to suggest that enough students would attend in the evening.