Linear functions are the most basic type of function. They are used extensively across STEM and other disciplines, especially to model the rate of physical, biological or economic change. Use this resource to learn about linear functions and graphs.
Linear functions create a straight line when graphed. They have the form:
\[y=mx+c\] where \(m\) is the slope of the line (or the gradient) and \(c\) is where the line crosses the \(y\)-axis (or the \(y\)-intercept).
When a function is linear, there is a constant rate of change. In other words, changing the \(x\) value causes a proportional change in the \(y\) value.
Graphs of linear functions
As you saw in Functions and relations, functions can be represented graphically. When you sketch a graph, you may not need to plot large numbers of points. Often, you just need the basic shape of the graph with some important points clearly labeled.
In the case of linear graphs, only two points are needed to sketch the graph. The intercepts are also important – that is, where the graph crosses the \(x\)- and \(y\)-axes.
The \(x\)-intercept is where the graph cuts the \(x\)-axis (\(y=0\)).
The \(y\)-intercept is where the graph cuts the \(y\)-axis (\(x=0\)).
For any linear graph, it should be clear where these intercepts are.
Example – graphing linear functions
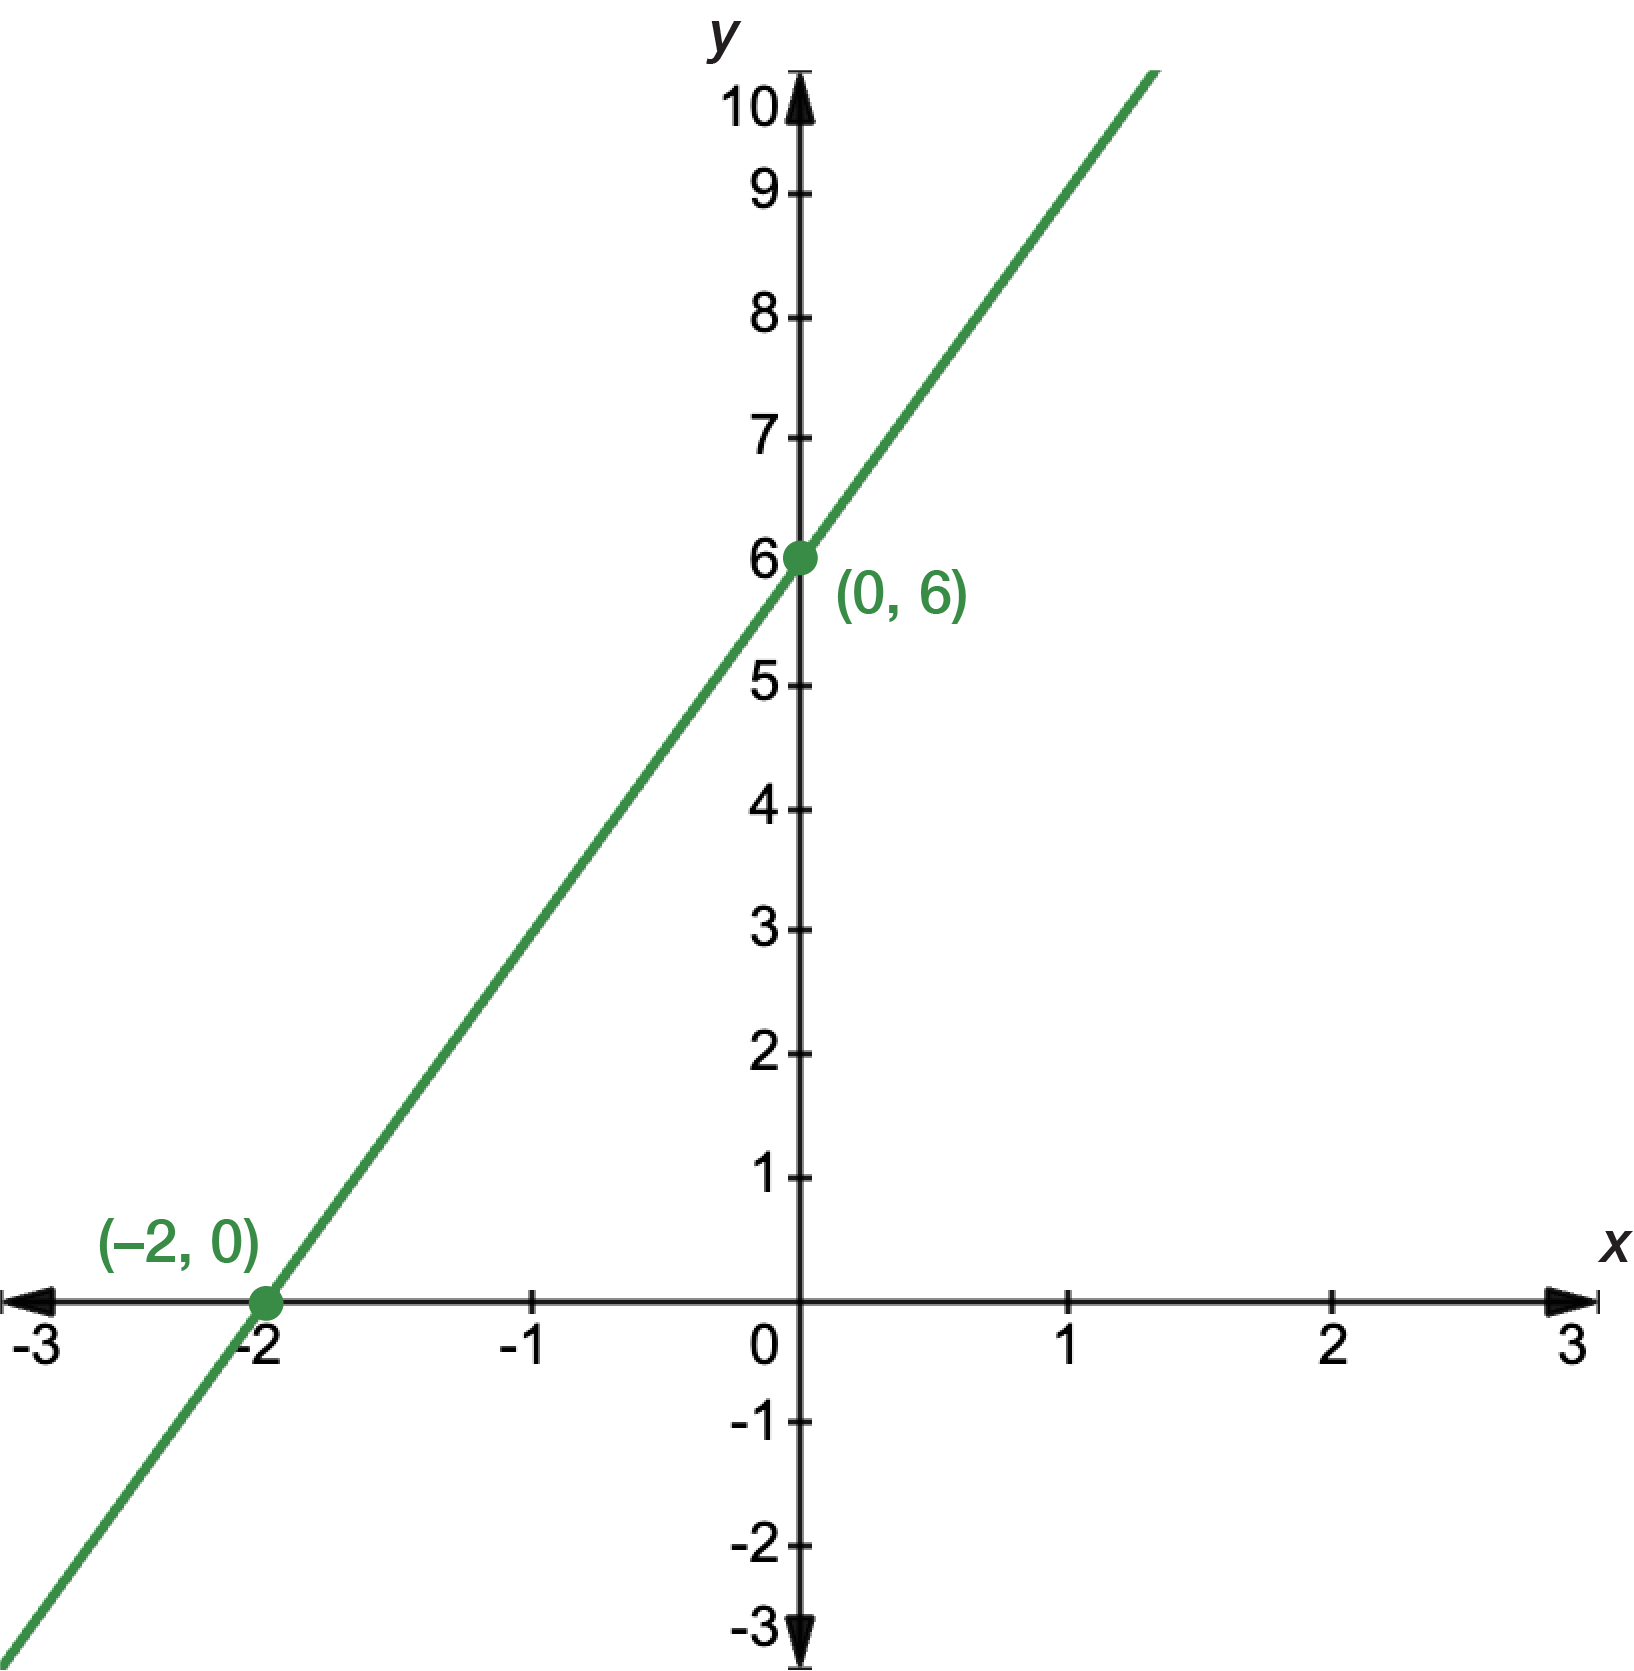
Sketch the function \(y=3x+6\).
We need to determine two points on the line. The \(x\)- and \(y\)-intercepts are often the easiest to find.
For the \(y\)-intercept, we substitute \(x=0\) into the equation for the function:
\[\begin{align*} y & = 3x+6\\
& = 3(0)+6\\
& = 6
\end{align*}\]
The \(y\)-intercept is at \((0,6)\).
For the \(x\)-intercept, we substitute \(y=0\) into the equation for the function:
\[\begin{align*} y & = 3x+6\\
(0) & = 3x+6\\
3x & = -6\\
x & = -2
\end{align*}\]
The \(x\)-intercept is at \((-2,0).\)
We have the points \((0,6)\) and \((-2,0)\) which we can plot on the Cartesian plane and connect with a straight line. The \(x\)- and \(y\)-intercepts should be marked on the graph.
If you need help, go to Plotting points on a graph.
Exercise – graphing linear functions
Sketch the graphs of the following equations.
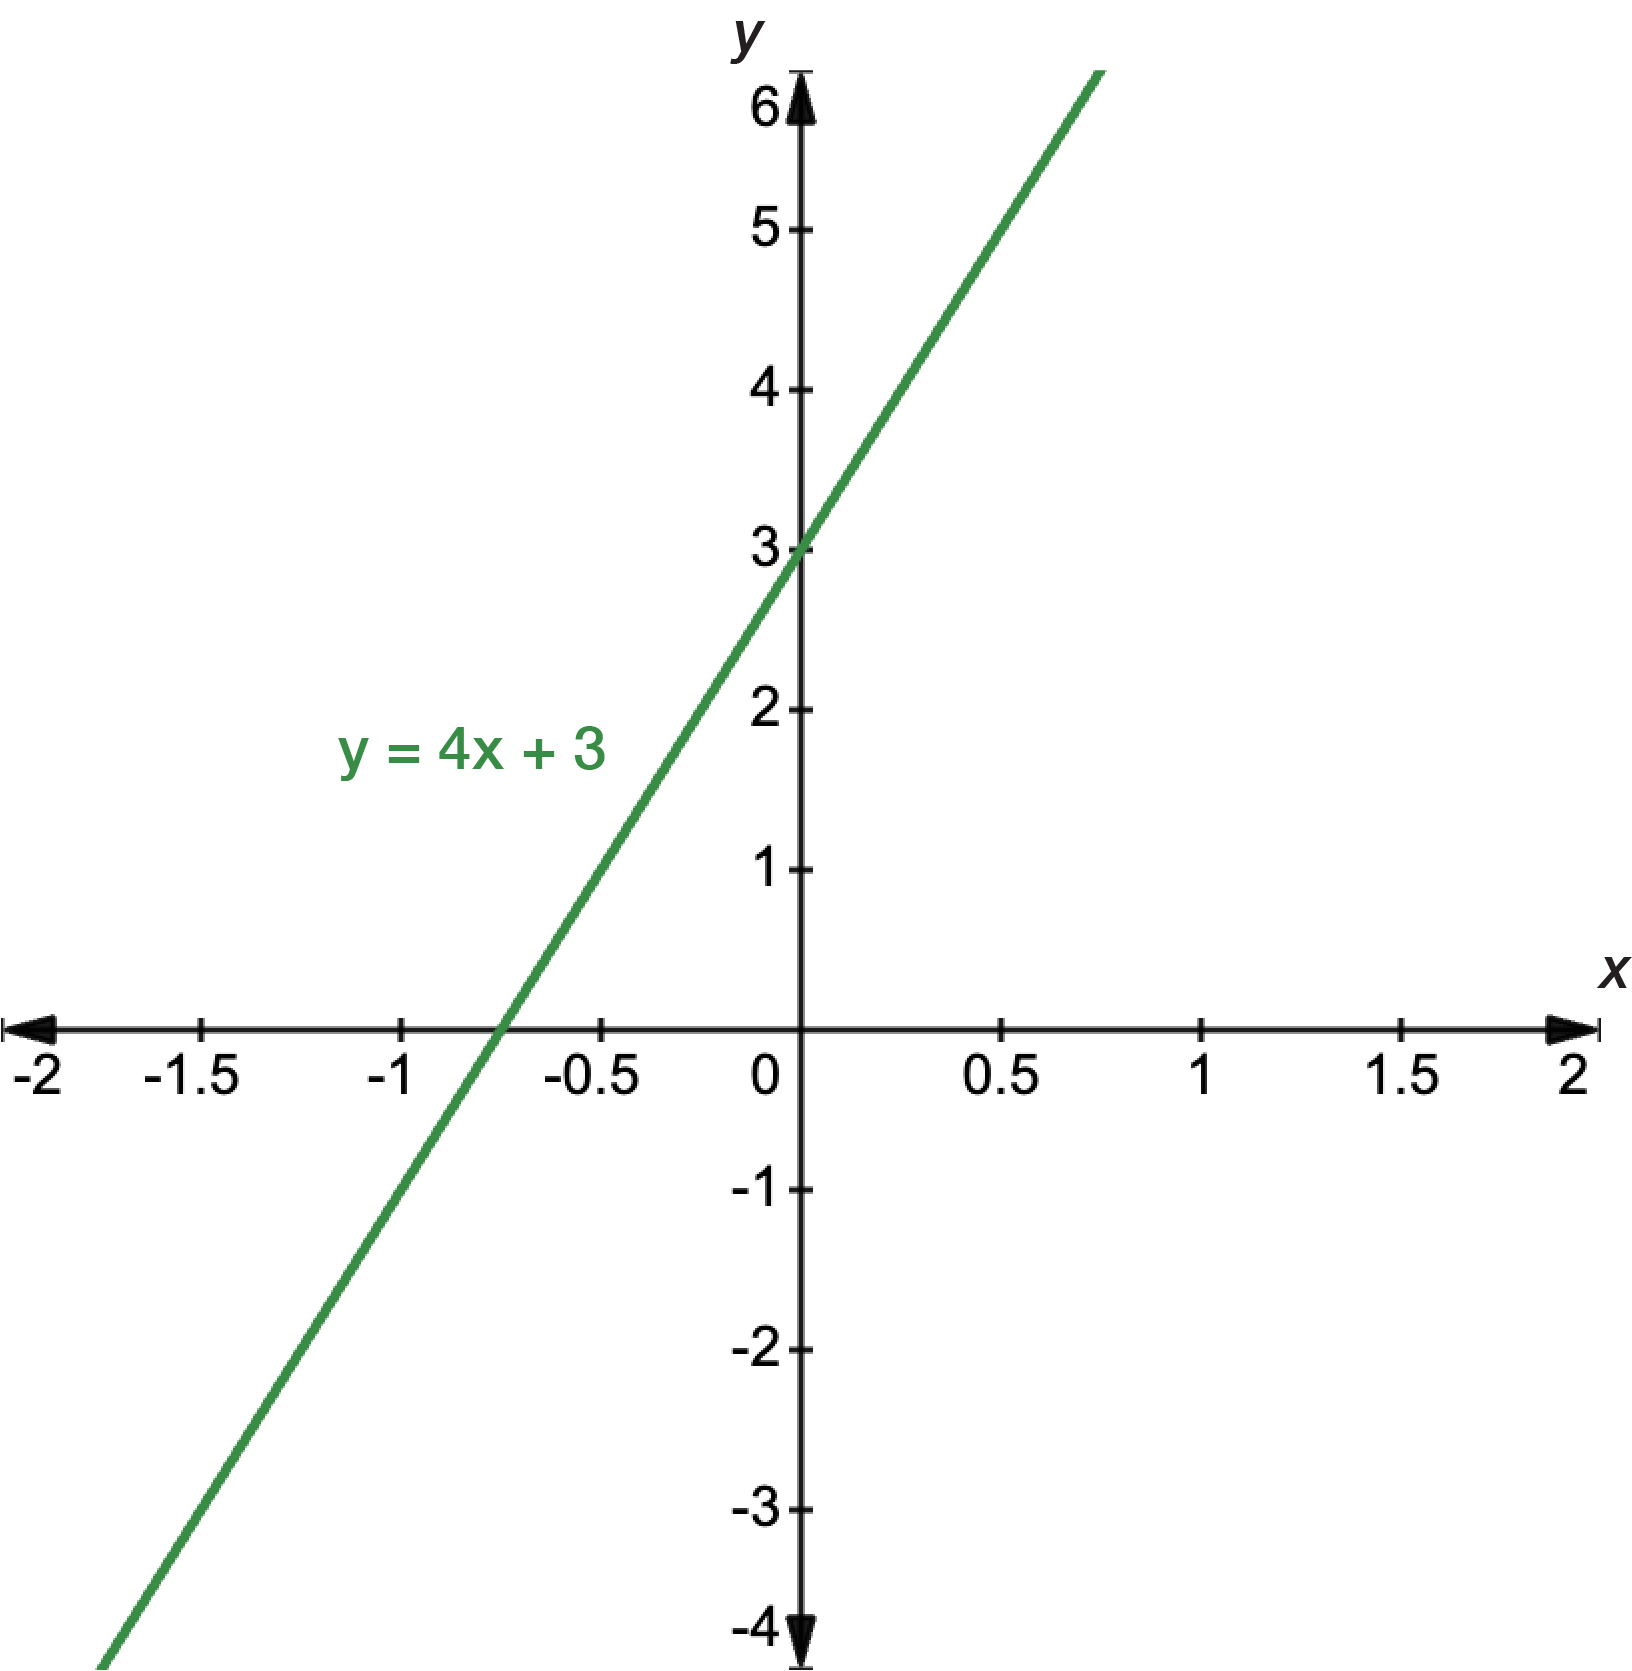
\(y=4x+3\)
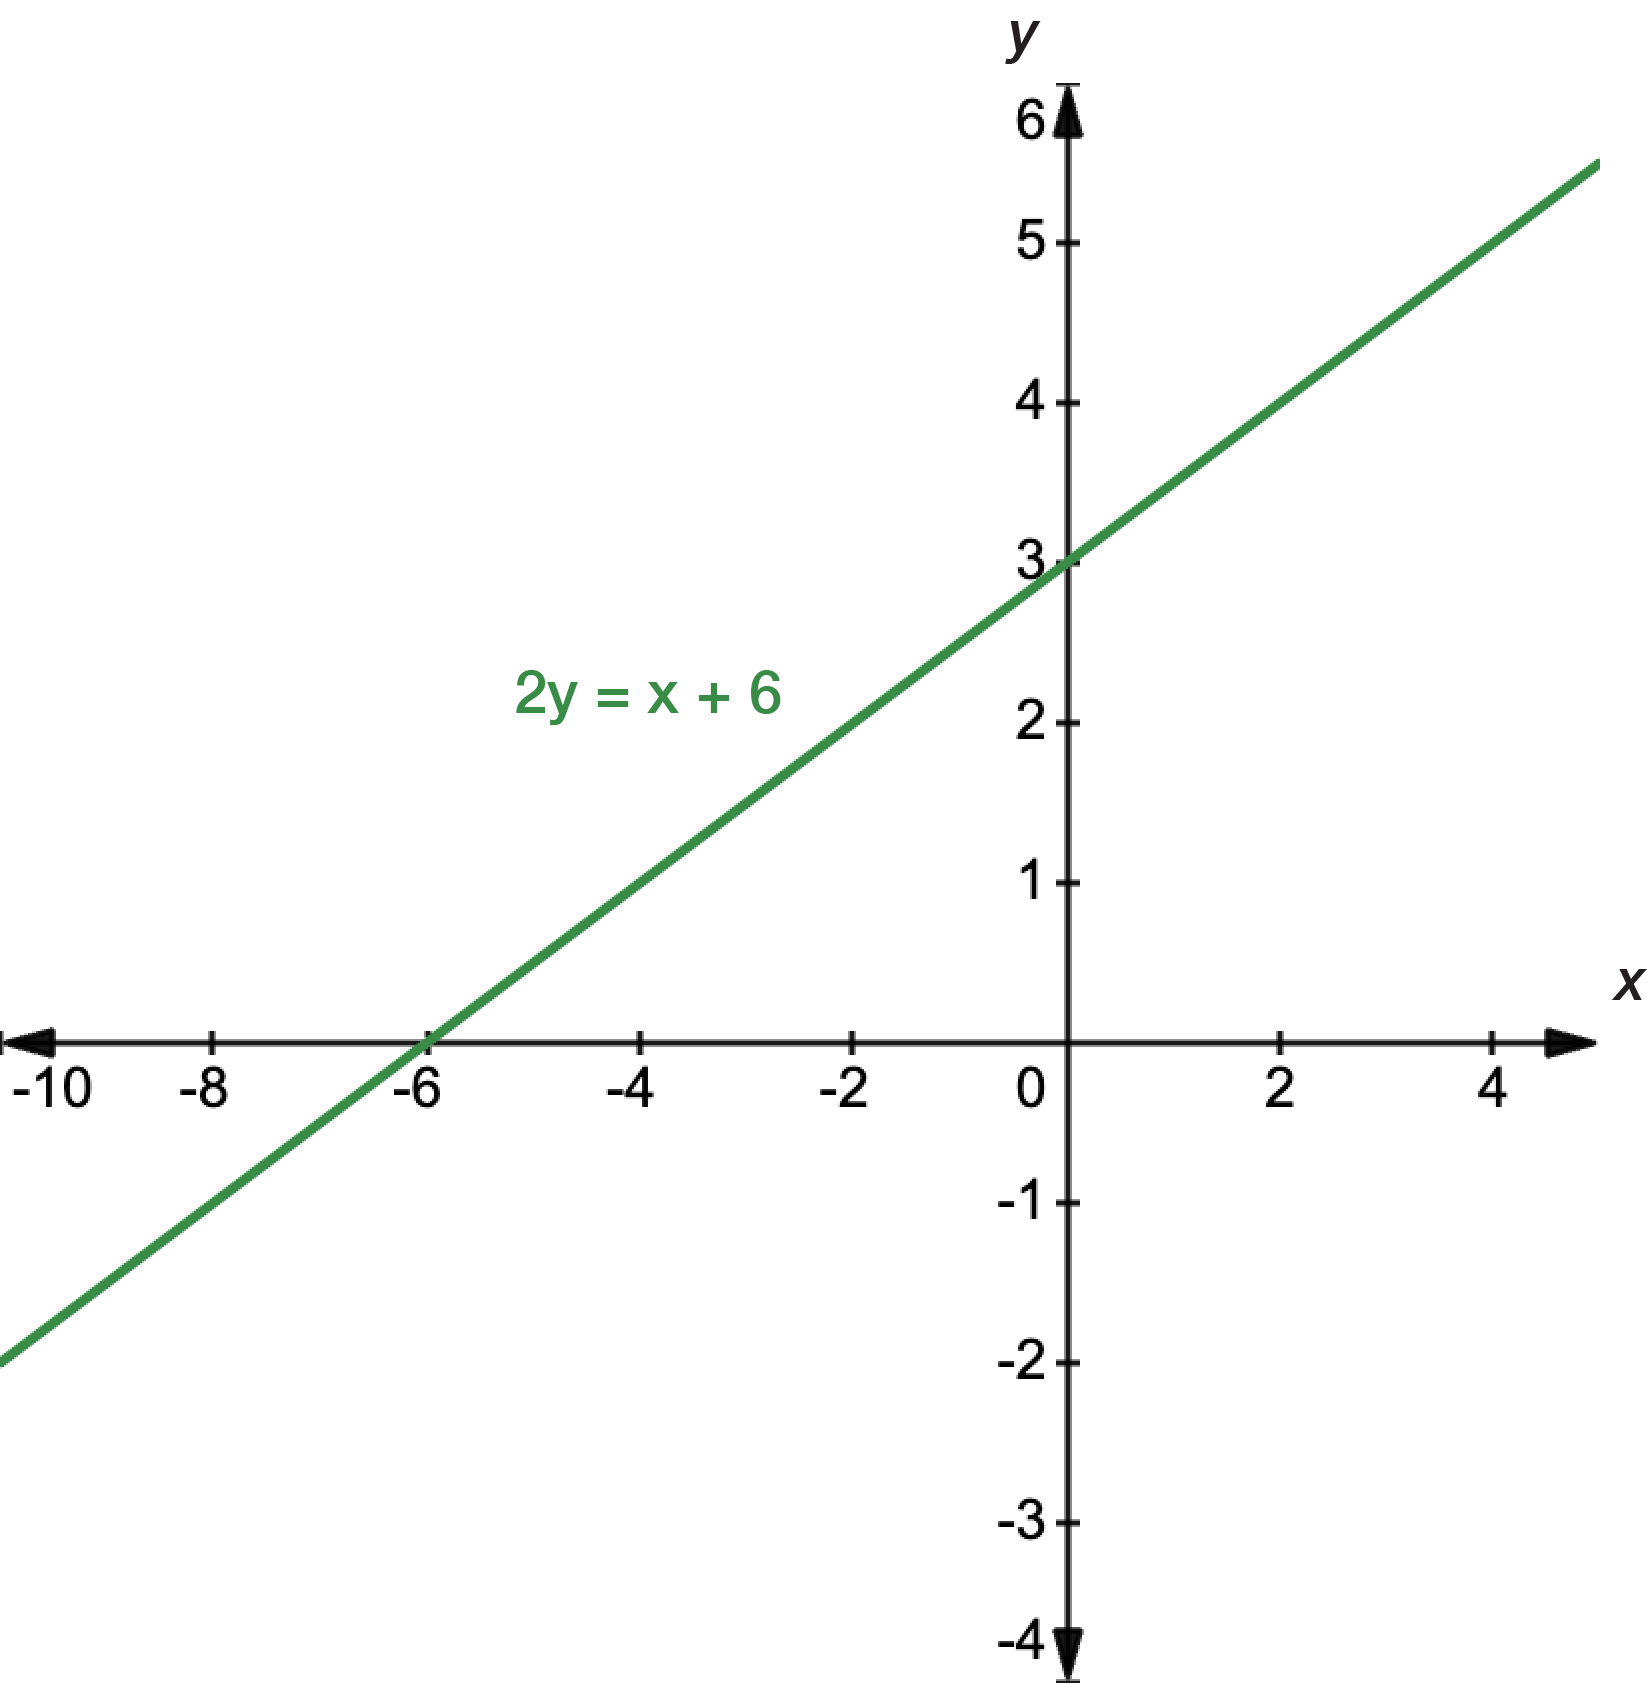
\(2y=-x+6\)
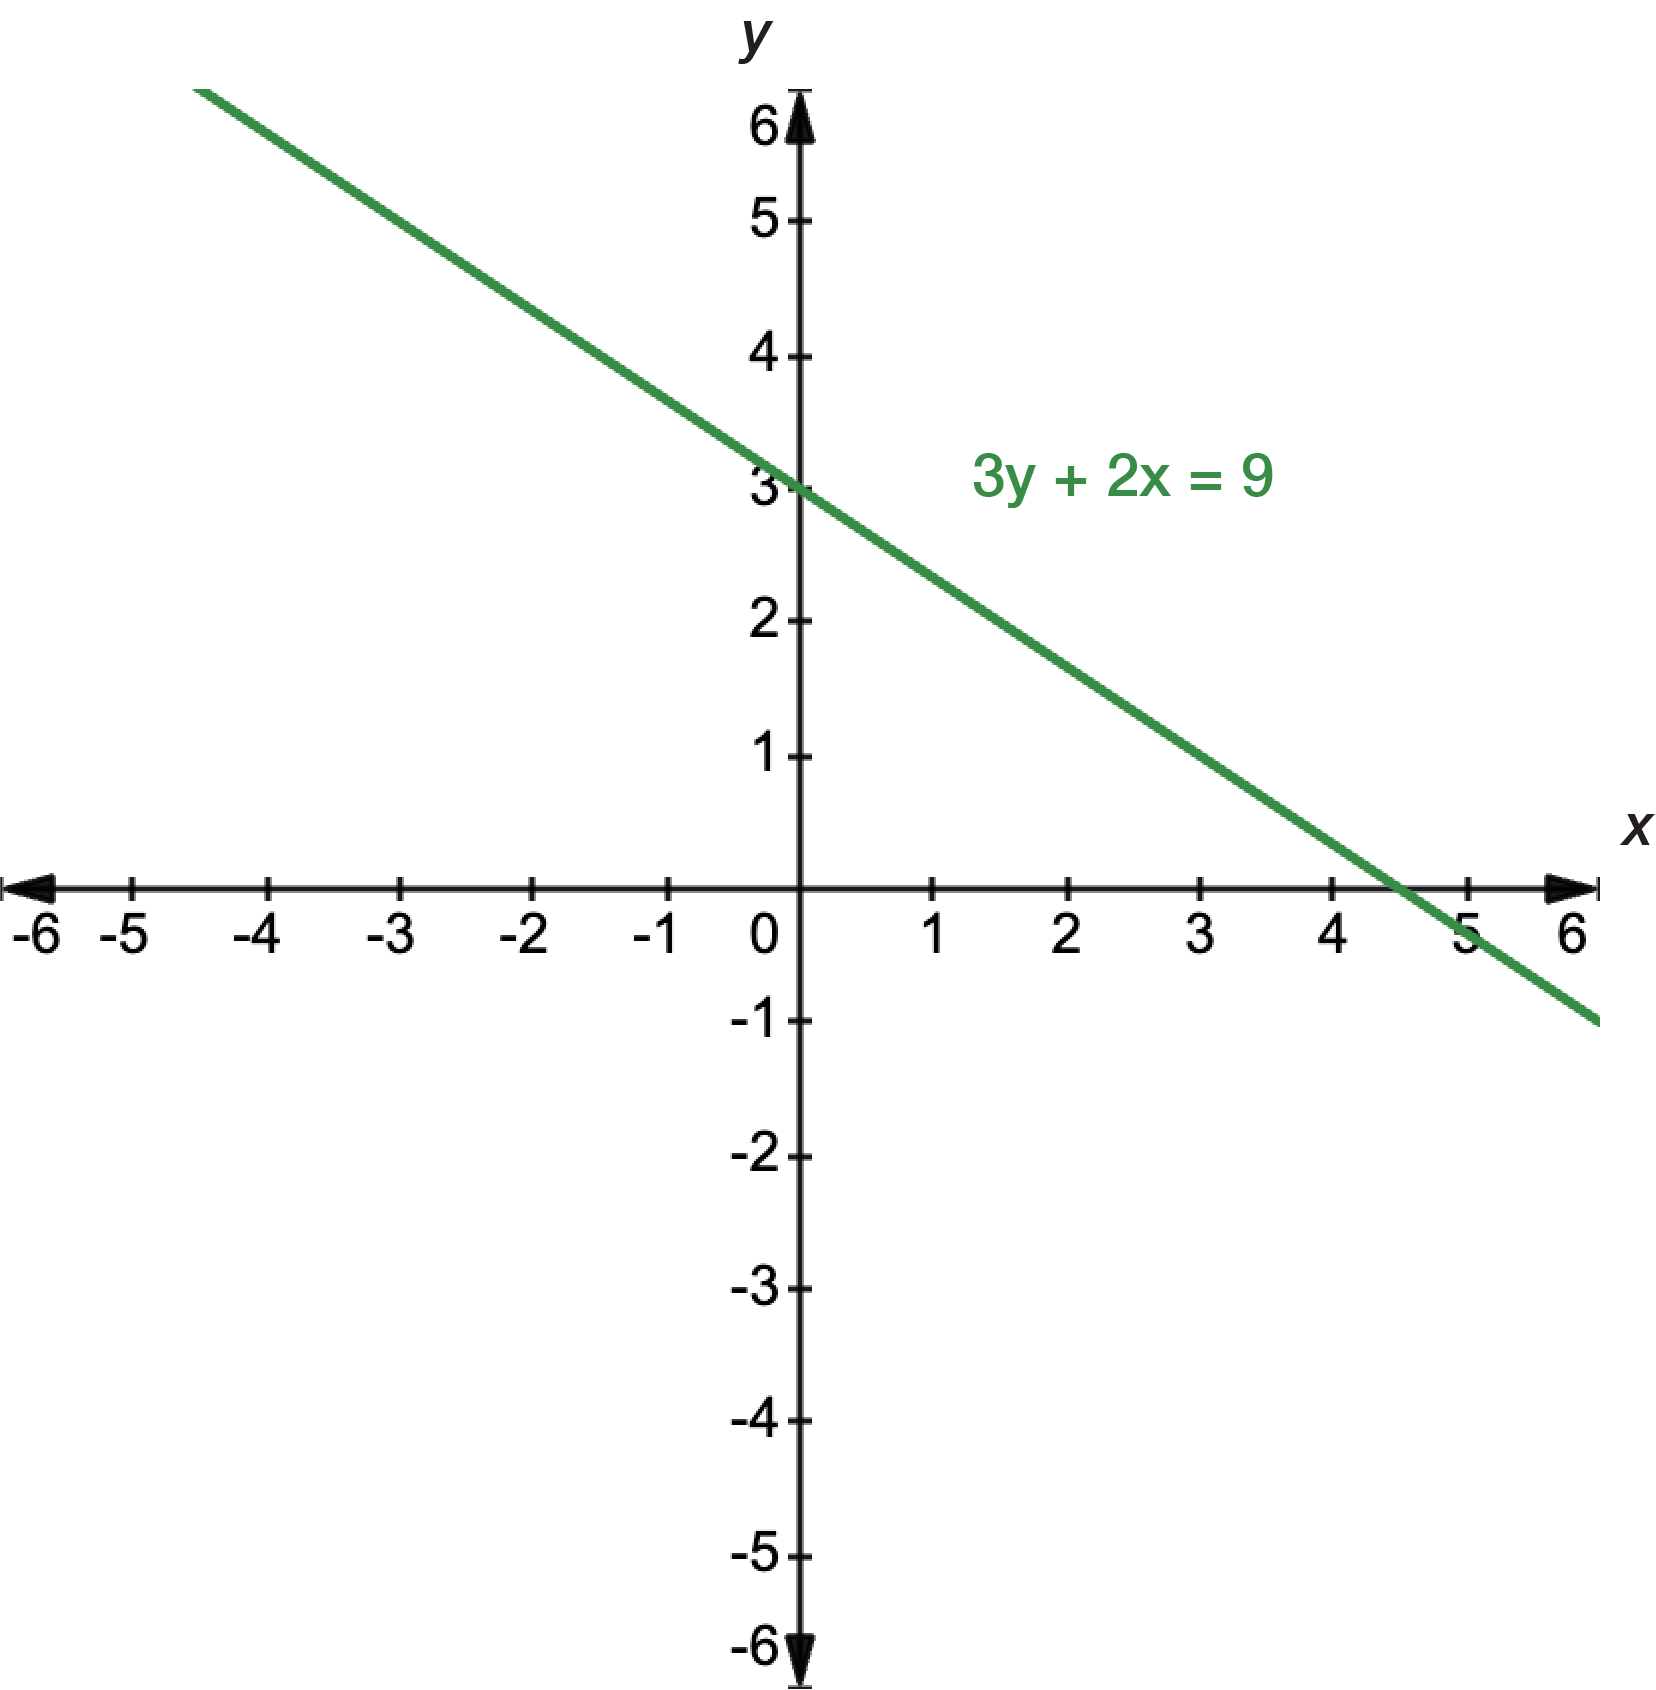
\(3y+2x=9\)
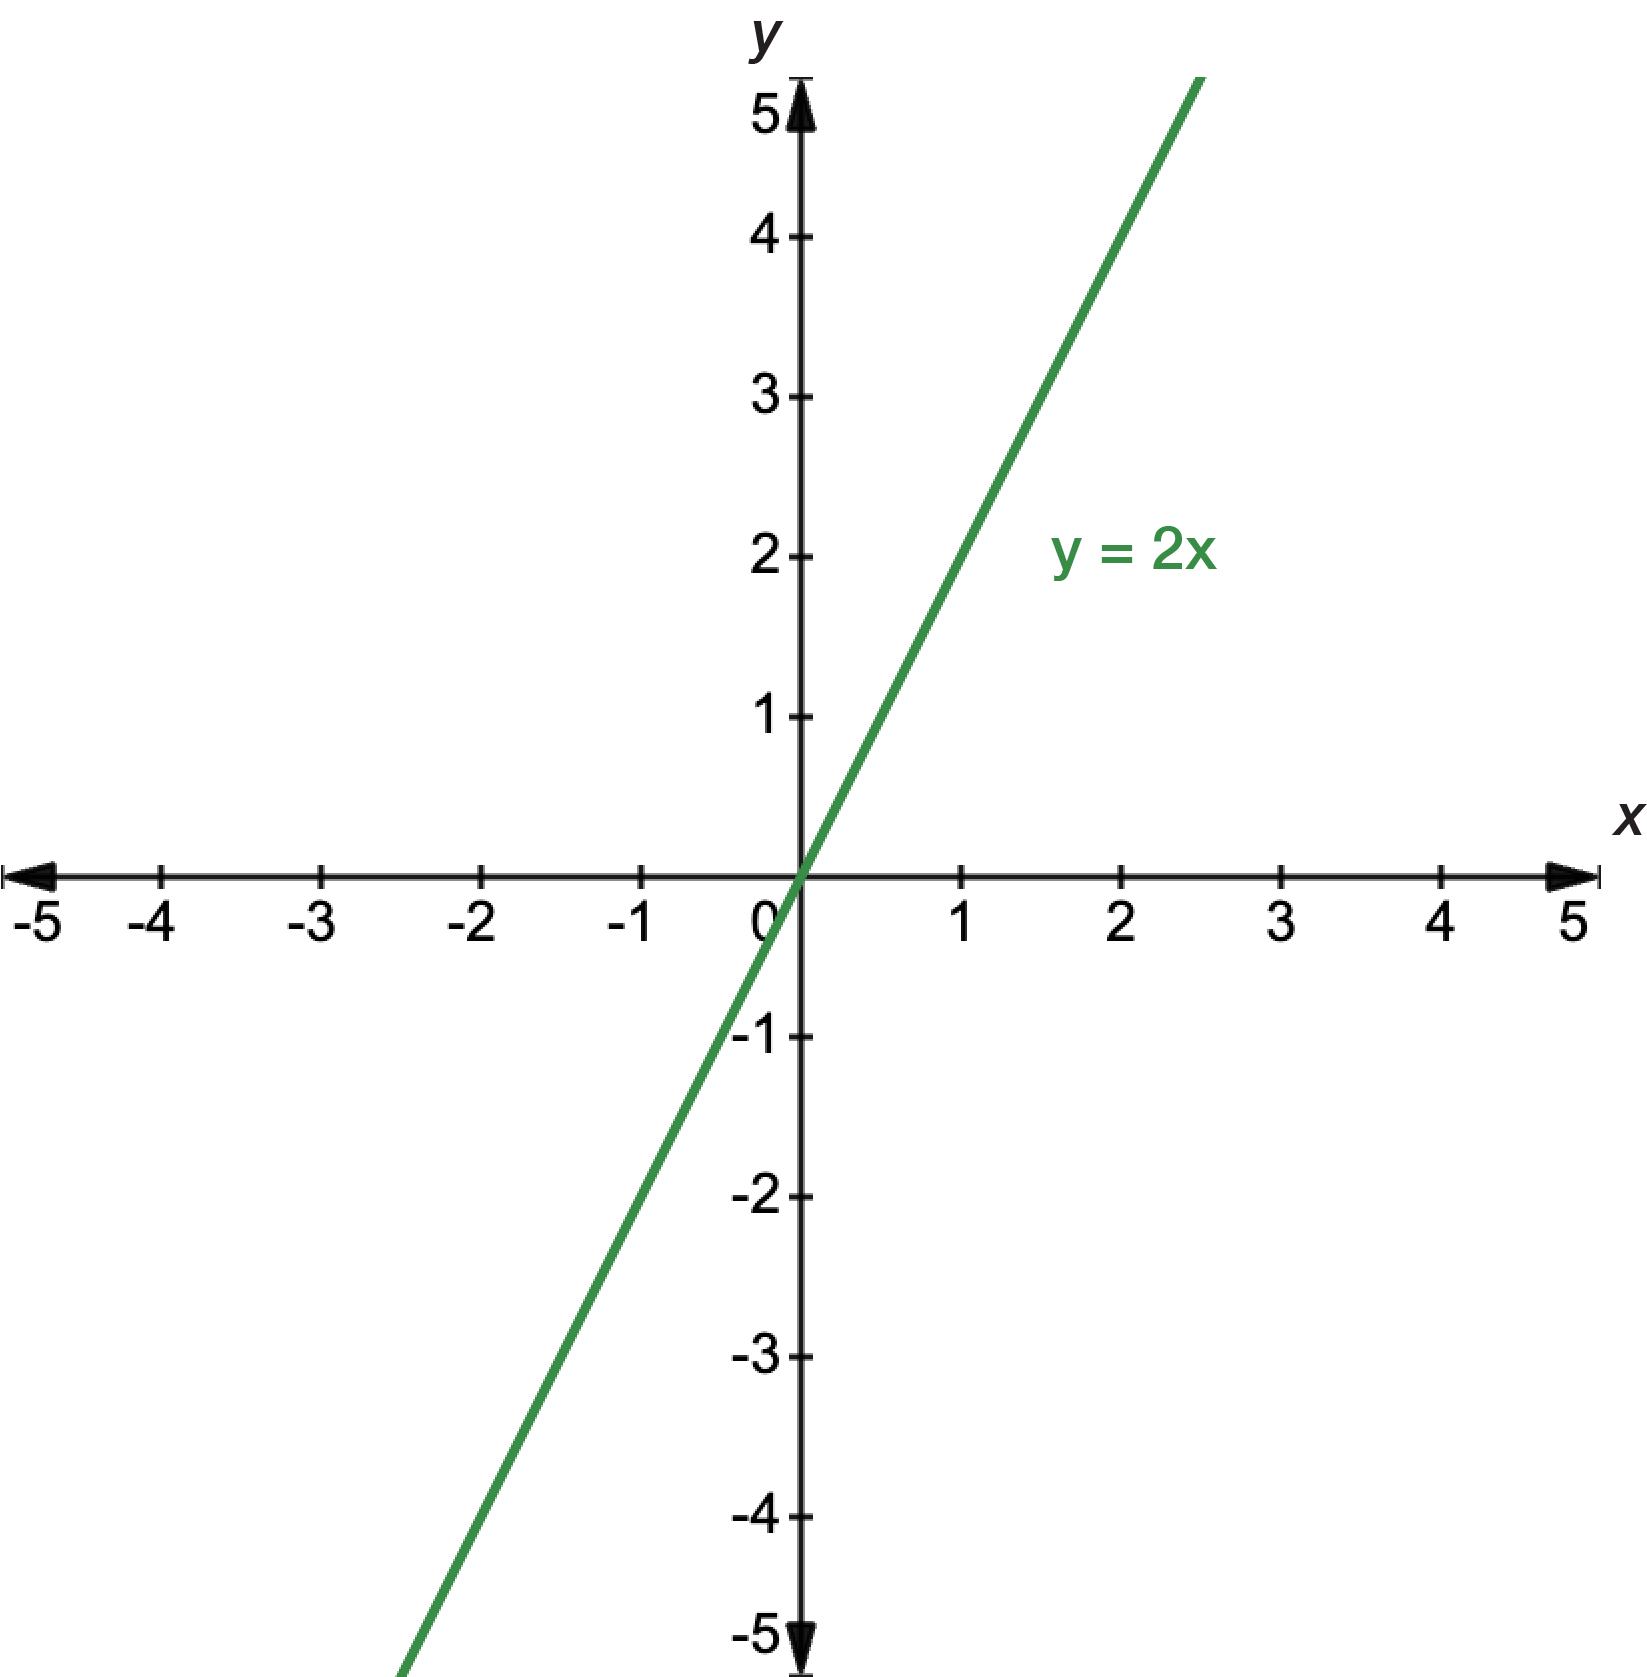
\(y=2x\)
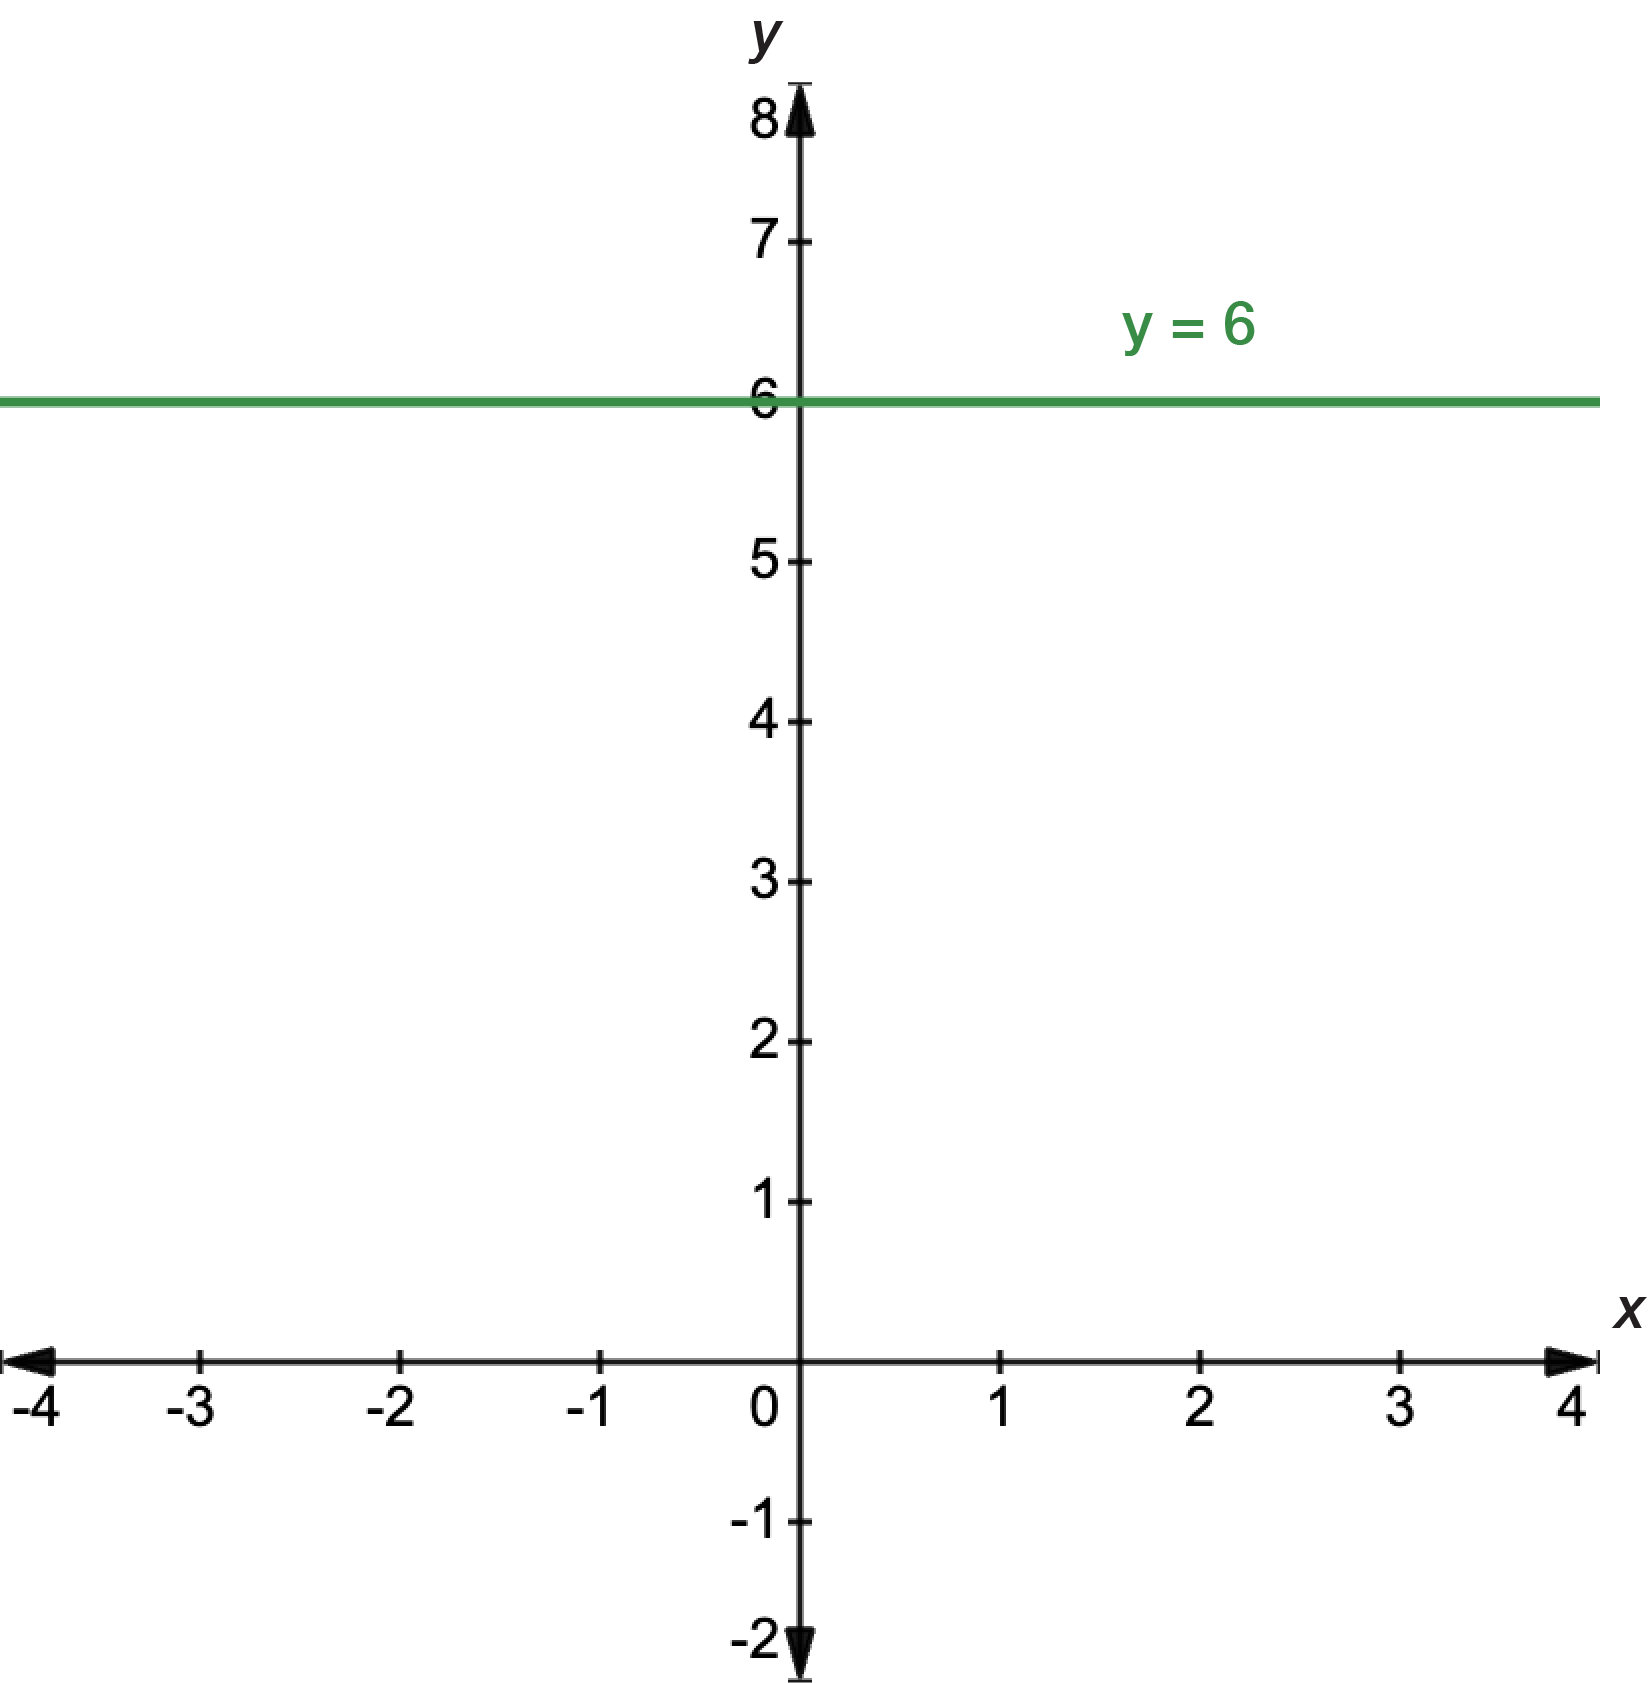
\(y=6\)
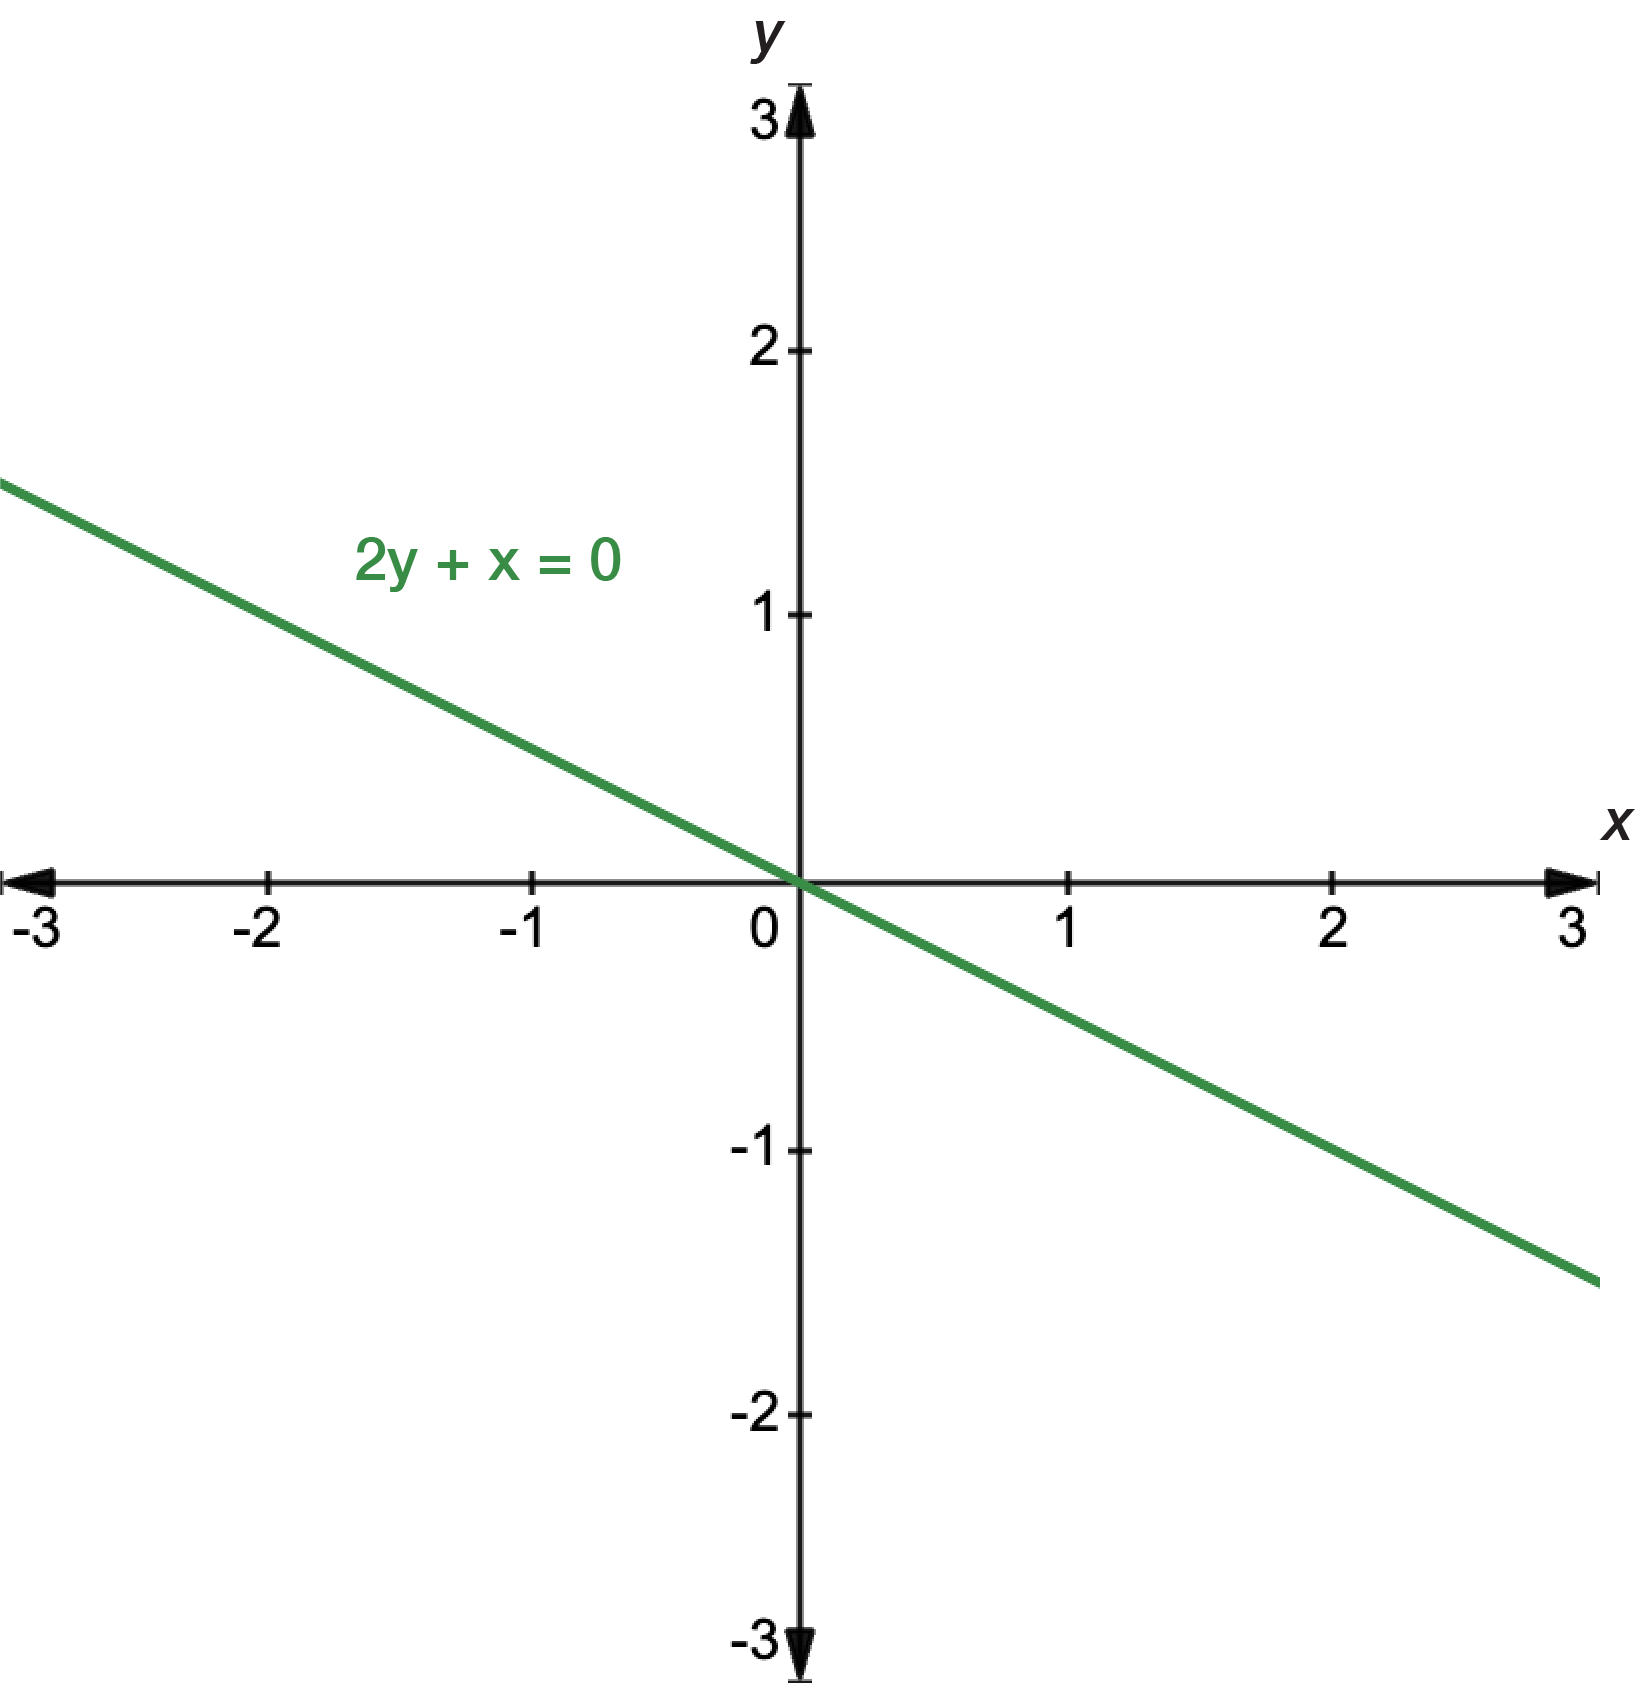
\(2y+x=0\)
\(y=4x+3\)
\(2y=x+6\)
\(3y+2x=9\)
\(y=2x\)
\(y=6\)
\(2y+x=0\)
Gradient
The gradient \(m\) indicates how steep the line of a graph is. It tells us how much the \(y\) value changes for every \(1\) unit increase in \(x\).
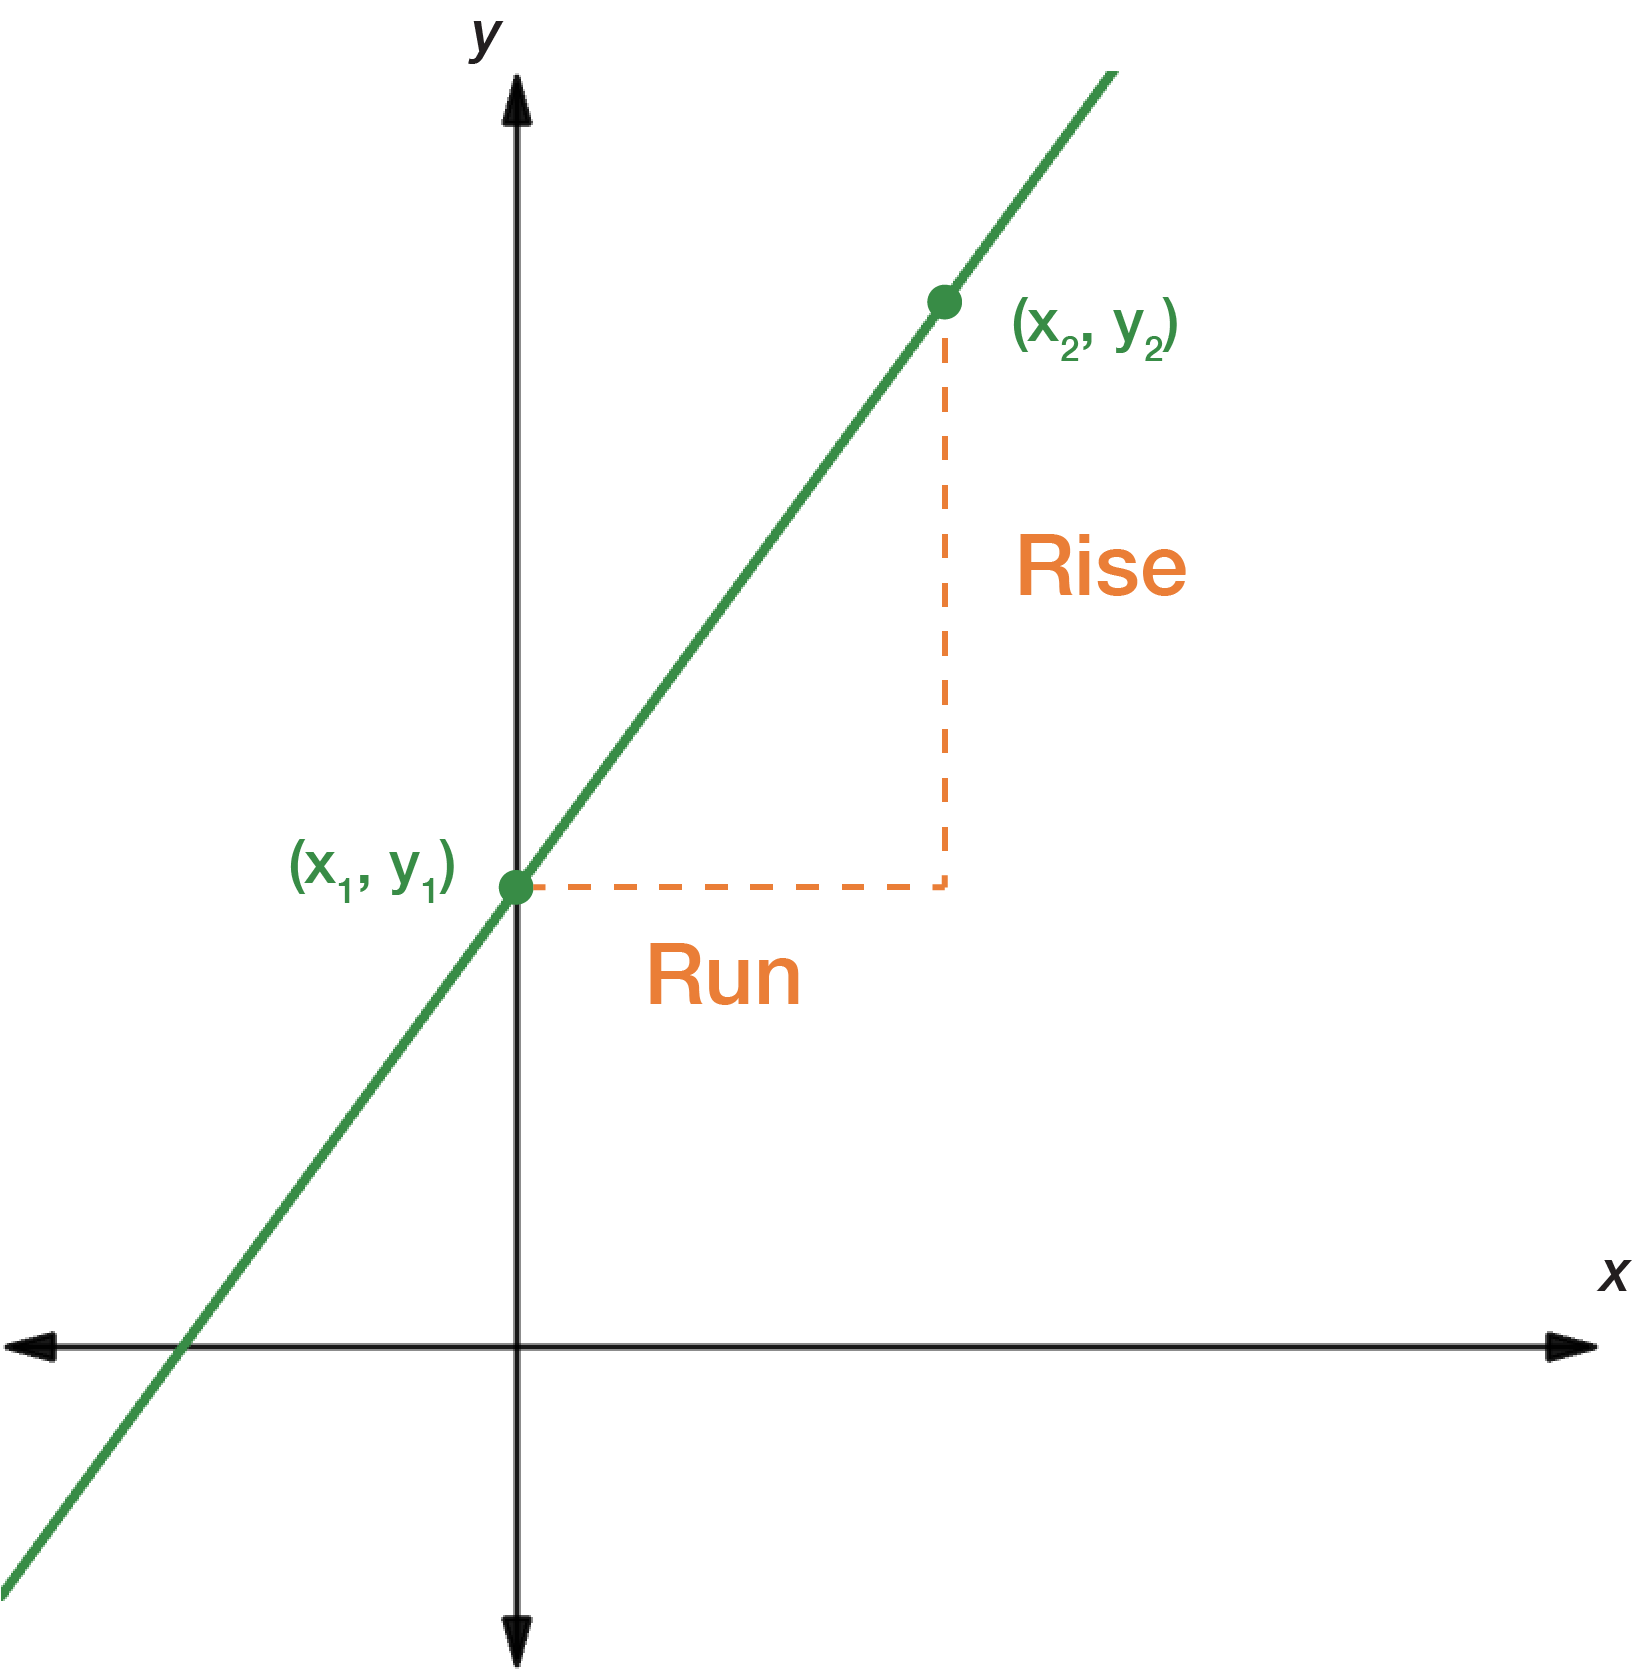
To calculate \(m\), we find the ratio of the vertical change (rise) to the horizontal change (run) between two points \((x_{1},y_{1})\) and \((x_{2},y_{2})\) on the line.
\[\begin{align*} m & = \frac{\textrm{Rise}}{\textrm{Run}}\\
& = \frac{y_{2}-y_{1}}{x_{2}-x_{1}}
\end{align*}\]
The appearance of a graph can tell you key information about the gradient.
A line that slopes up to the right has a positive gradient.
A line that slopes down to the right has a negative gradient.
Parallel lines have the same gradient.
When you multiply the gradients of two mutually perpendicular lines, you get \(-1\).
A line parallel to the \(x\)-axis has a gradient of \(0\).
A line parallel to the \(y\)-axis does not have a defined gradient. In fact, the line is not a function; it is a relation.
Example 1 – calculating the gradient of a linear function
Find the gradient of the line \(y=3x+6\).
This is the same function as Example 1 – graphing linear functions. We found two points, the intercepts: \((0,6)\) and \((-2,0)\). We can use these to calculate the gradient.
Let \((x_{1},y_{1})\) be \((0,6)\) and \((x_{2},y_{2})\) be \((-2,0)\).
\[\begin{align*} m & = \frac{y_{2}-y_{1}}{x_{2}-x_{1}}\\
& = \frac{0-6}{-2-0}\\
& = \frac{-6}{-2}\\
& = 3
\end{align*}\]
It doesn't matter which points we assigned \((x_{1},y_{1})\) and \((x_{2},y_{2})\), as long as they lie on the line.
If the equation is in the form \(y=mx+c\), you can easily tell what the gradient \(m\) is. \(y=3x+6\) is in this form, so \(m=3\).
Find the gradient of the line joining the two points \((1,3)\) and \((4,5)\).
Let \((x_{1},y_{1})\) be \((1,3)\) and \((x_{2},y_{2})\) be \((4,5)\).
\[\begin{align*} m & = \frac{y_{2}-y_{1}}{x_{2}-x_{1}}\\
& = \frac{5-3}{4-1}\\
& = \frac{2}{3}
\end{align*}\]
Exercise – calculating the gradient of a linear function
Find the gradient of the following straight lines.
\(y=-5x\)
\(2y=6x+9\)
\(2x-3y=0\)
\(3y+2x-2=0\)
\(5y=8\)
\(x=-2\)
\(m=-5\)
\(m=3\)
\(m=\dfrac{2}{3}\)
\(m=-\dfrac{2}{3}\)
\(m=0\)
Not a function, so \(m\) is undefined
Equation of a straight line
As well as \(y=mx+c\), the equation of a straight line can be written in point—slope form:
\[y-y_{1}=m(x-x_{1})\] where \(m\) is the gradient and \((x_{1},y_{1})\) is a point on the line.
This shows that as long as you know the slope and one point on the line, you can find the equation of the line.
Here is how the point—slope form is derived.
If \((x_{1},y_{1})\) is a point on the line with a gradient of \(m\), then it must satisfy \(y=mx+c\). This means by substituting \(x=x_{1}\) and \(y=y_{1}\) into the equation:
\[y_{1}=mx_{1}+c\]
We can then subtract this from \(y=mx+c\) to get:
\[\begin{align*} y-y_{1} & = mx+c-(mx_{1}+c)\\
& = mx-mx_{1}+c-c\\
& = m(x-x_{1})
\end{align*}\]
Example 1 – finding the equation of a line
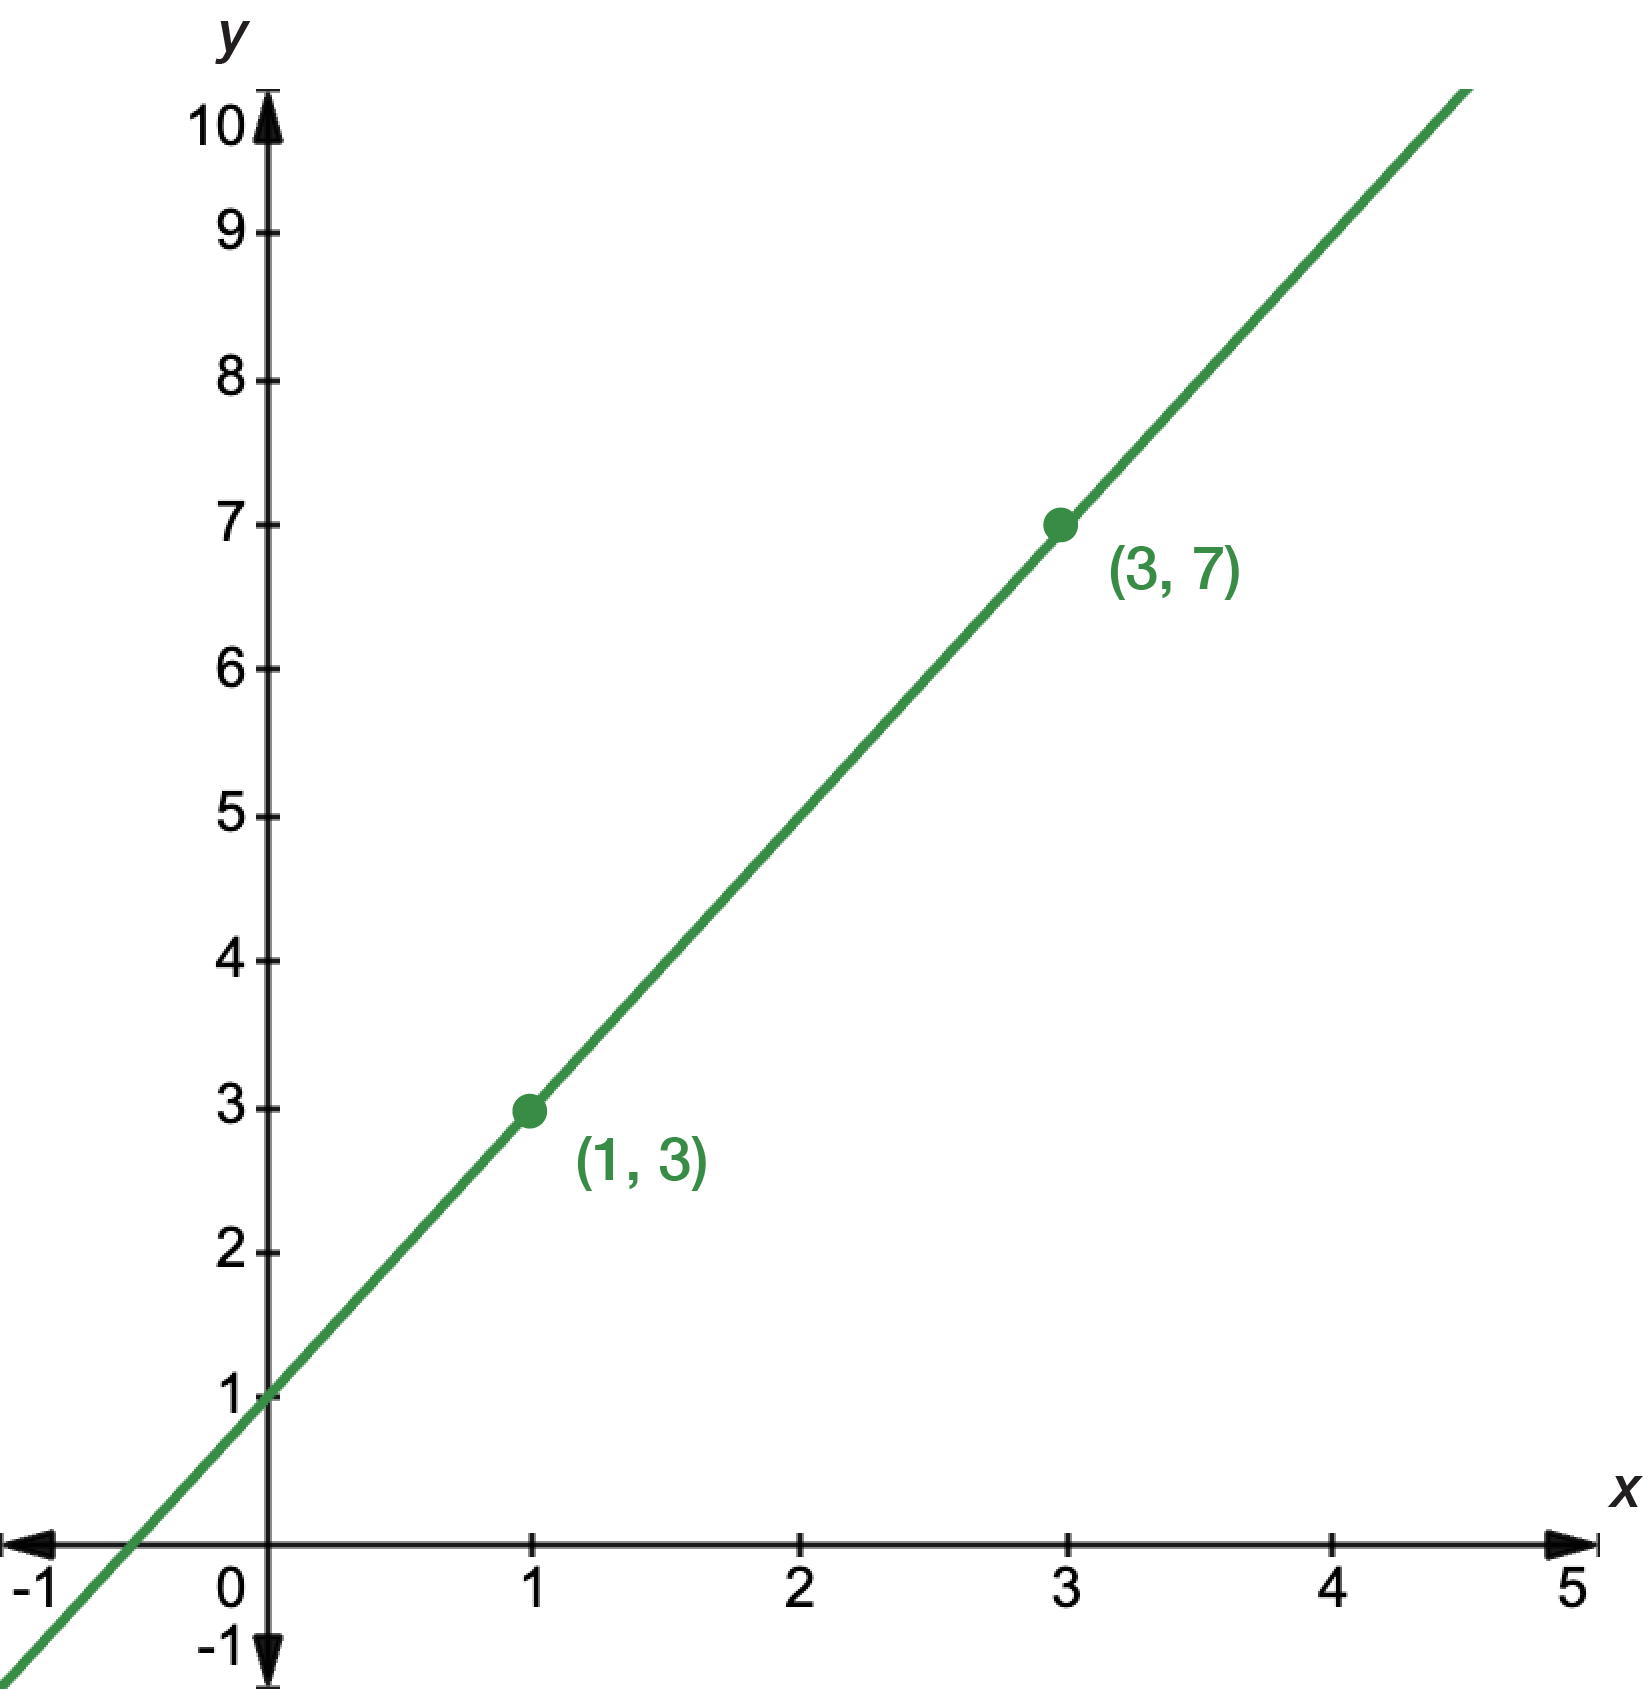
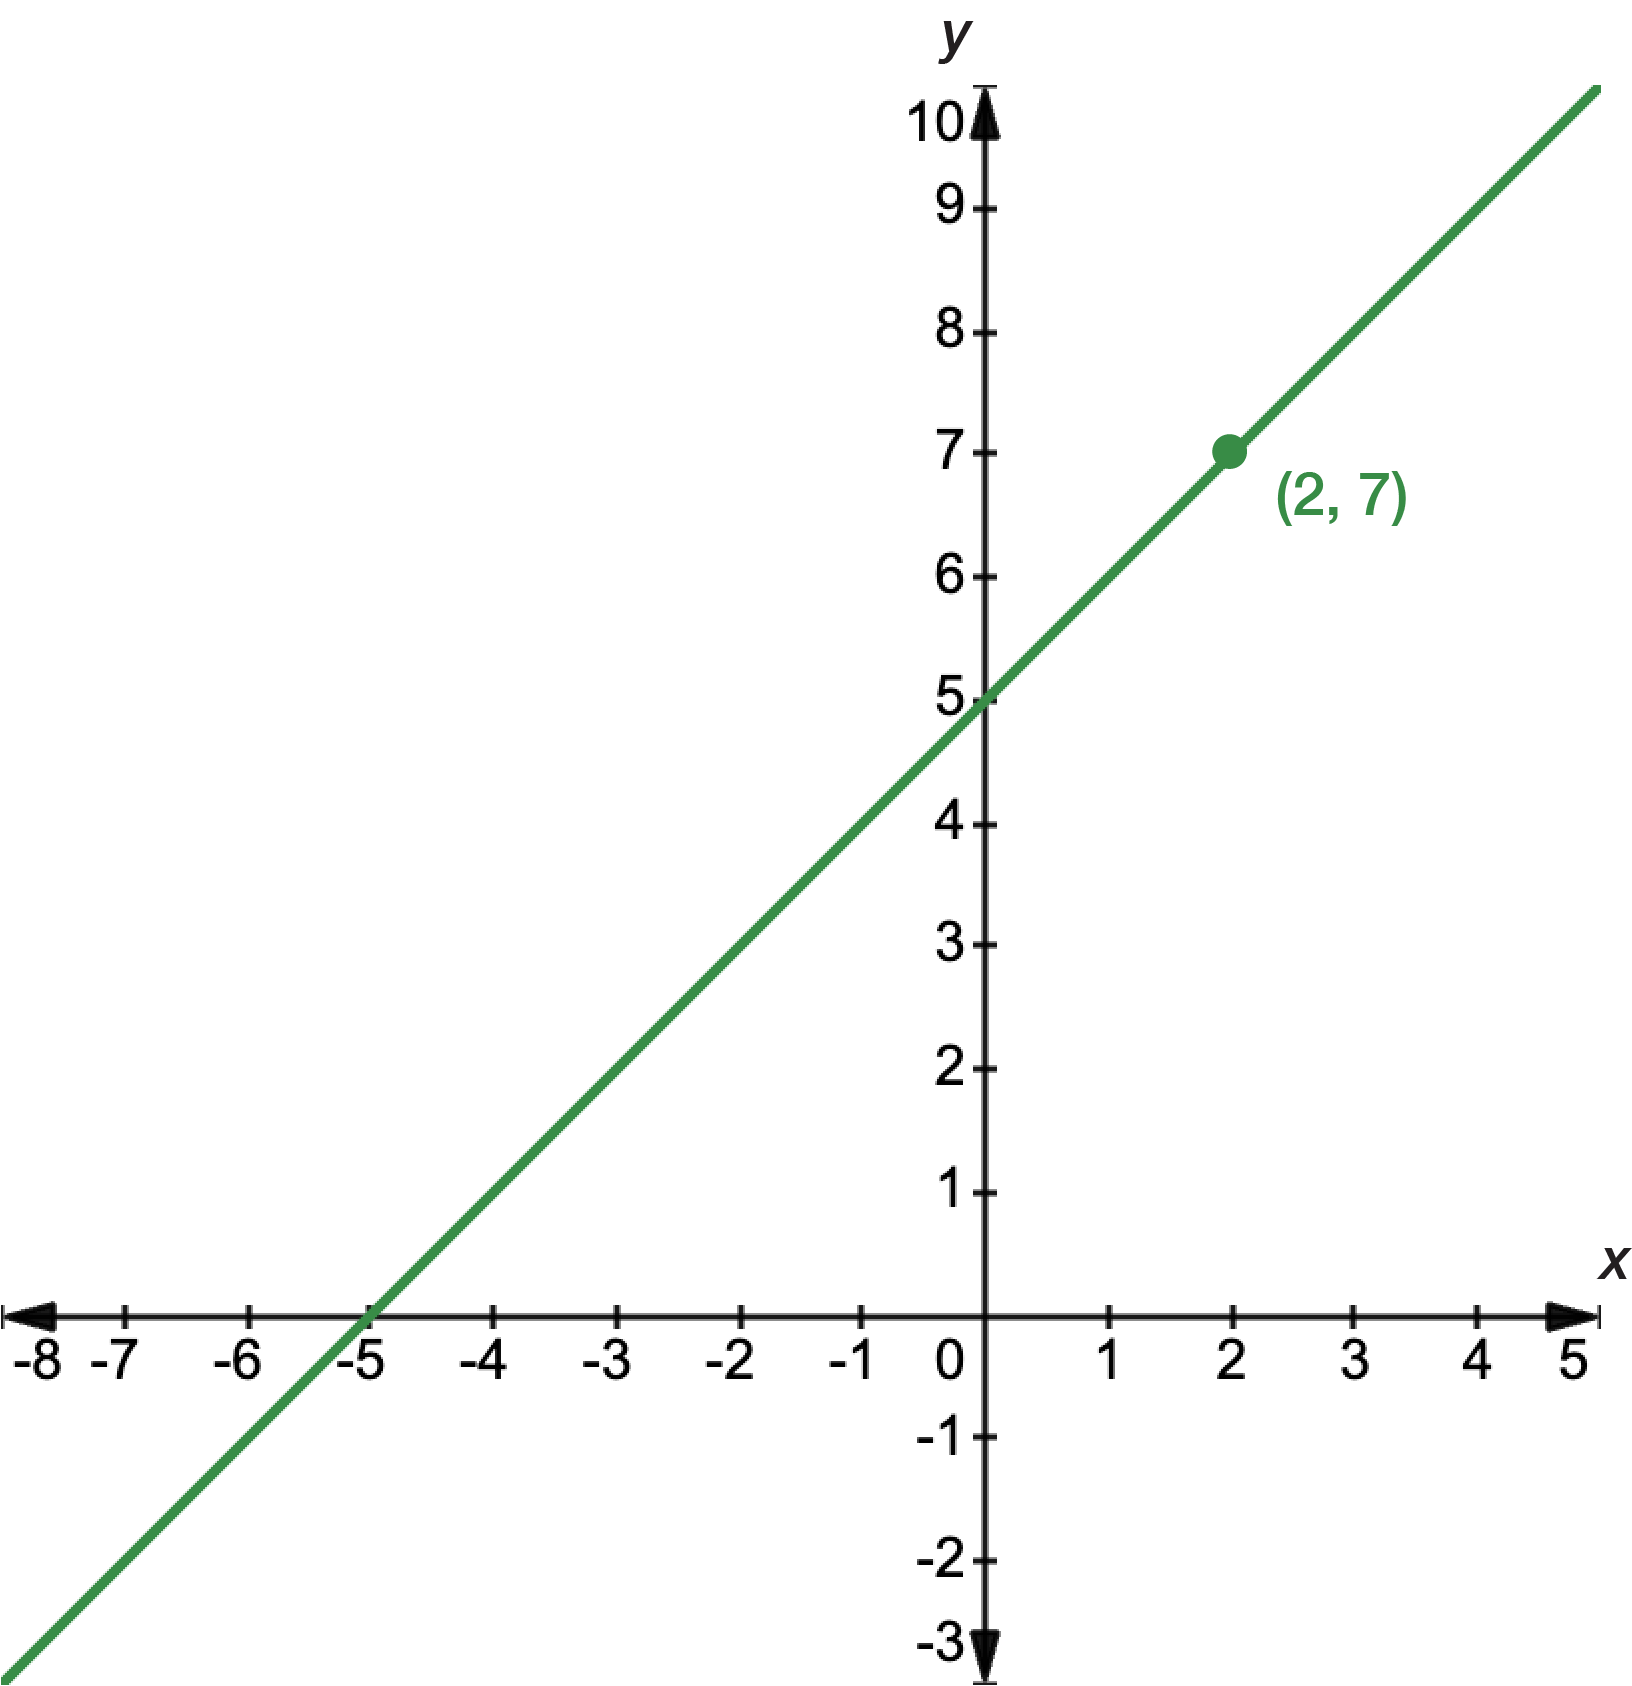
Find the gradient and the equation of the straight line shown in the graph.
The graph has a positive gradient because it slopes up towards the right. You don’t have to write this down but it is a good check to have in mind. If you calculate a negative gradient, you know something has gone wrong.
We have been given two points, \((1,3)\) and \((3,7)\). We can let these be \((x_{1},y_{1})\) and \((x_{2},y_{2})\), respectively, then calculate the gradient.
\[\begin{align*} m & = \frac{y_{2}-y_{1}}{x_{2}-x_{1}}\\
& = \frac{7-3}{3-1}\\
& = \frac{4}{2}\\
& = 2
\end{align*}\]
To find \(c\), we can substitute either \((x_{1},y_{1})\) or \((x_{2},y_{2})\) into the point—slope form, but we should also remember that \(c\) is the \(y\)-intercept... which we have been given in the graph! The graph intersects the \(y\)-axis at \(1\), so \(c=1\).
Therefore, the equation of the line is \(y=2x+1\).
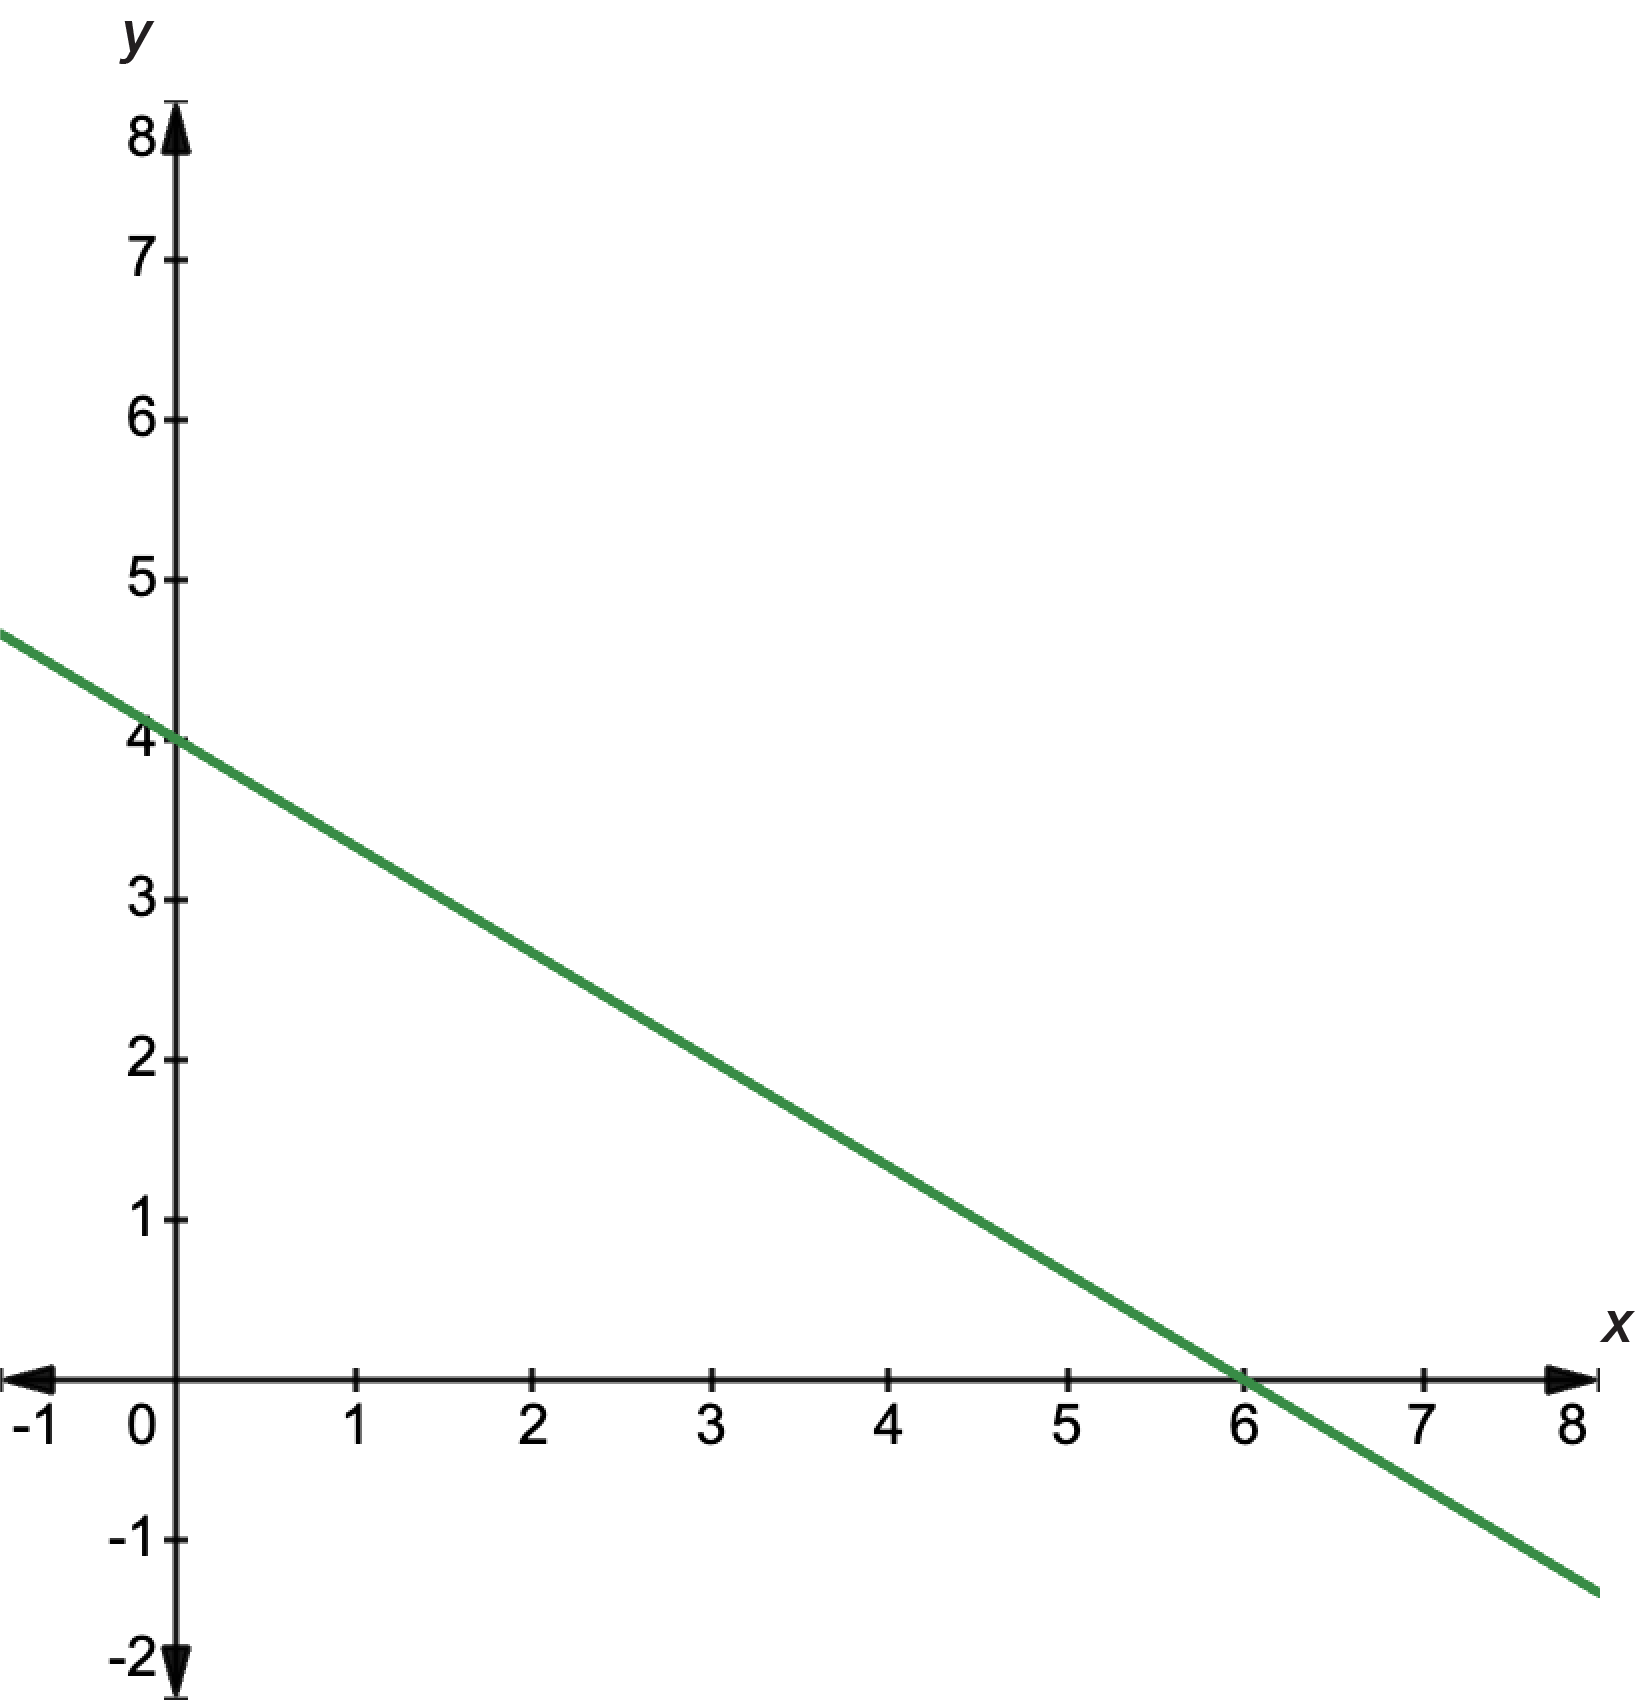
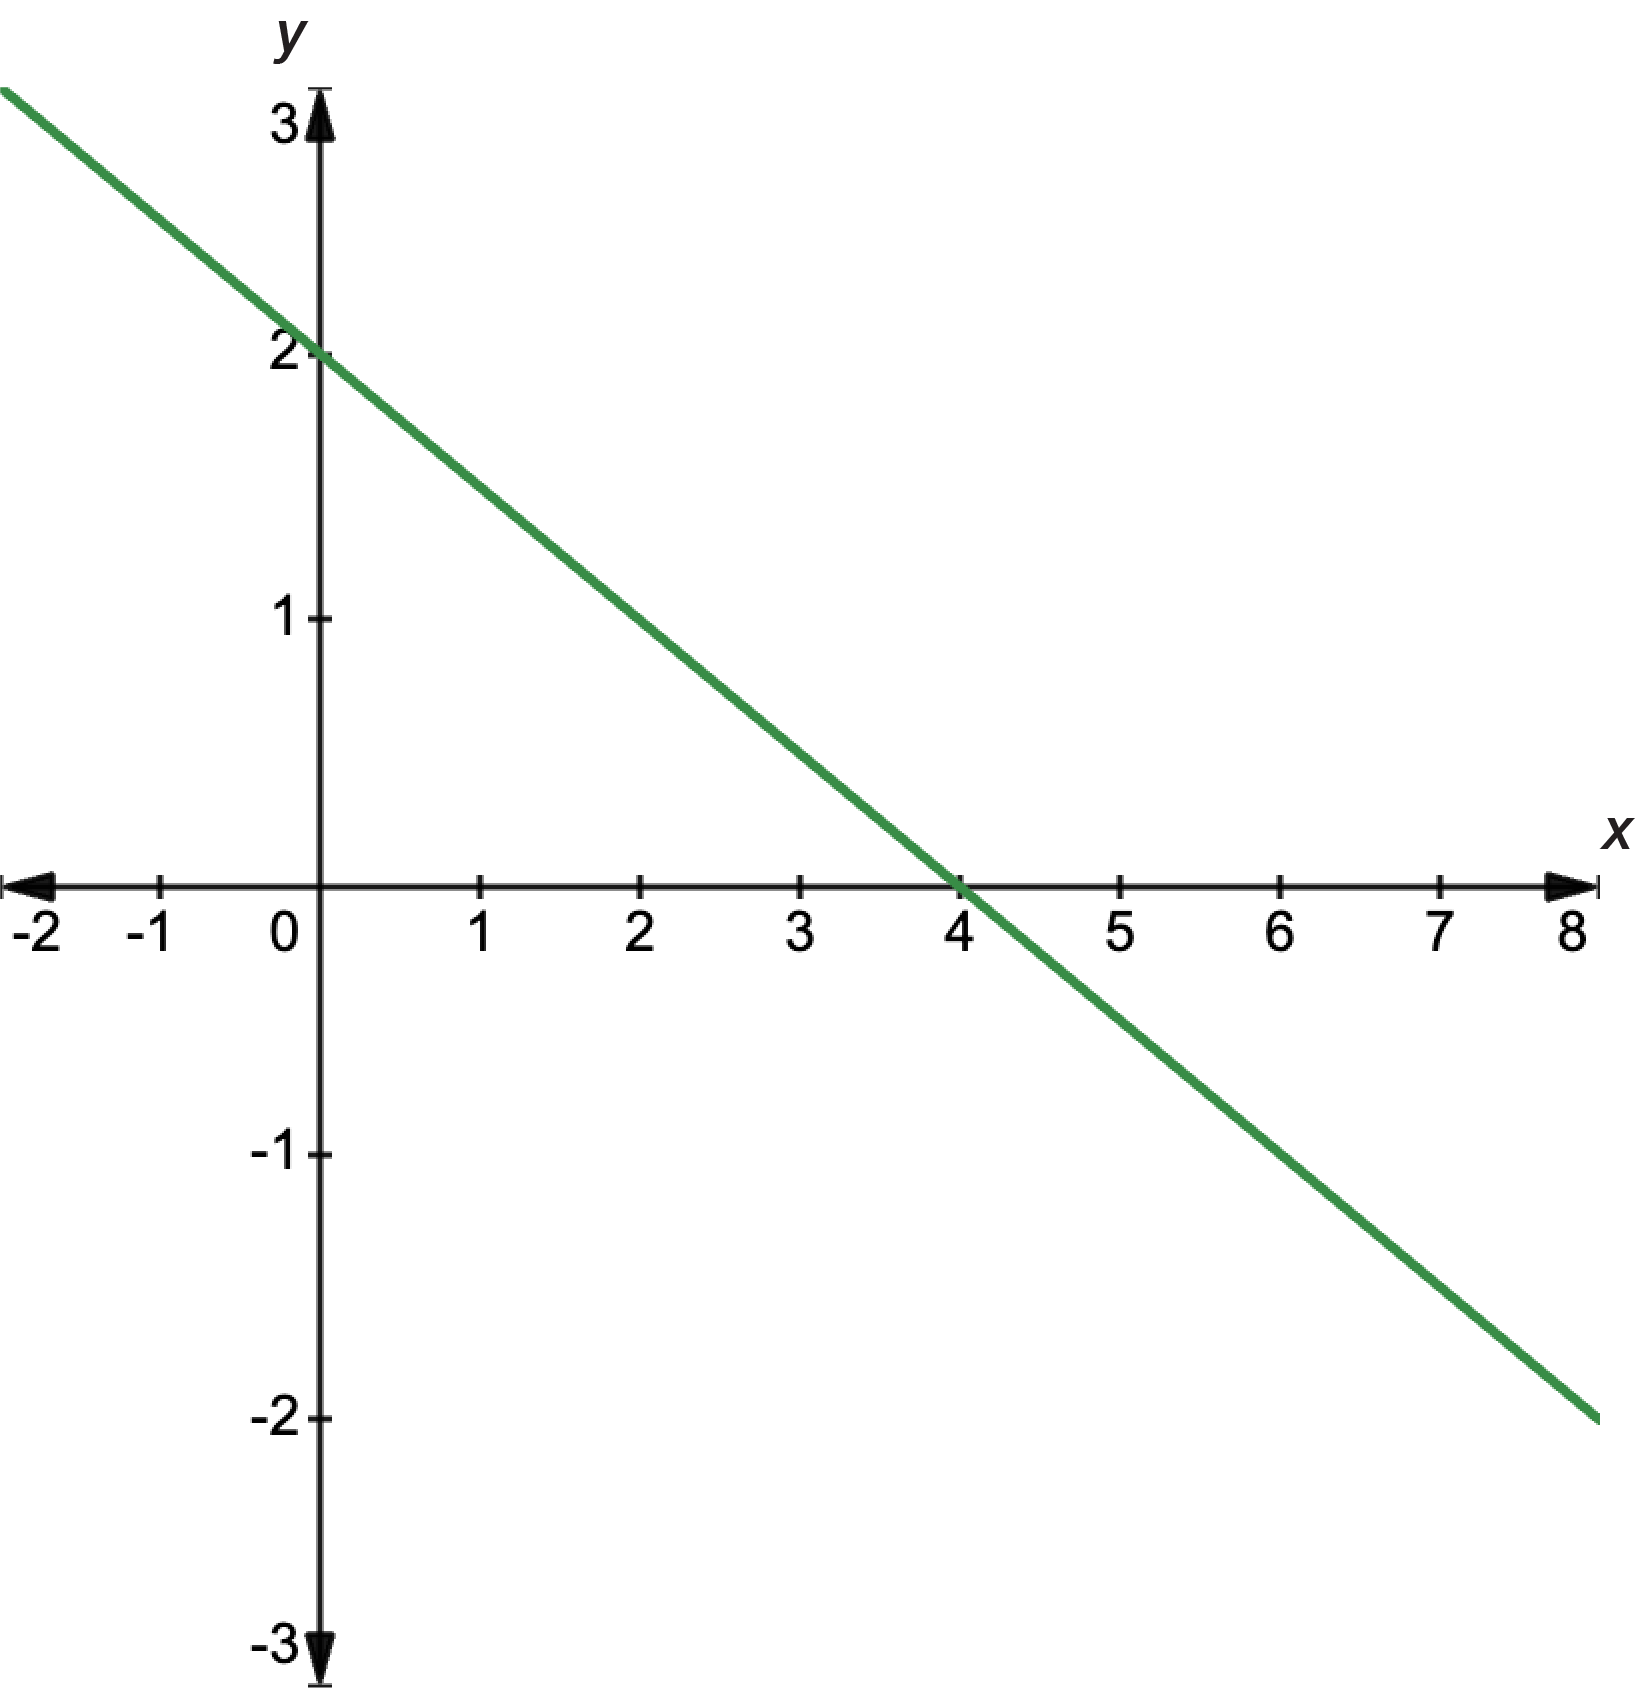
Find the gradient and the equation of the straight line shown in the graph.
The graph has a negative gradient because it slopes down towards the right. We have been given two points, \((0,4)\) and \((6,0)\). The gradient is:
\[\begin{align*} m & = \frac{y_{2}-y_{1}}{x_{2}-x_{1}}\\
& = \frac{0-4}{6-0}\\
& = \frac{-4}{6}\\
& = -\frac{2}{3}
\end{align*}\]
The \(y\)-intercept is at \(4\), so \(c=4\).
Therefore, the equation of the line is \(y=-\dfrac{2}{3}+4\). This is a correct answer, but the fraction makes it look a bit ugly. We can multiply both sides by \(3\) to get rid of the fraction. The equation then becomes \(3y=-2x+12\) or \(3y+2x=12\).
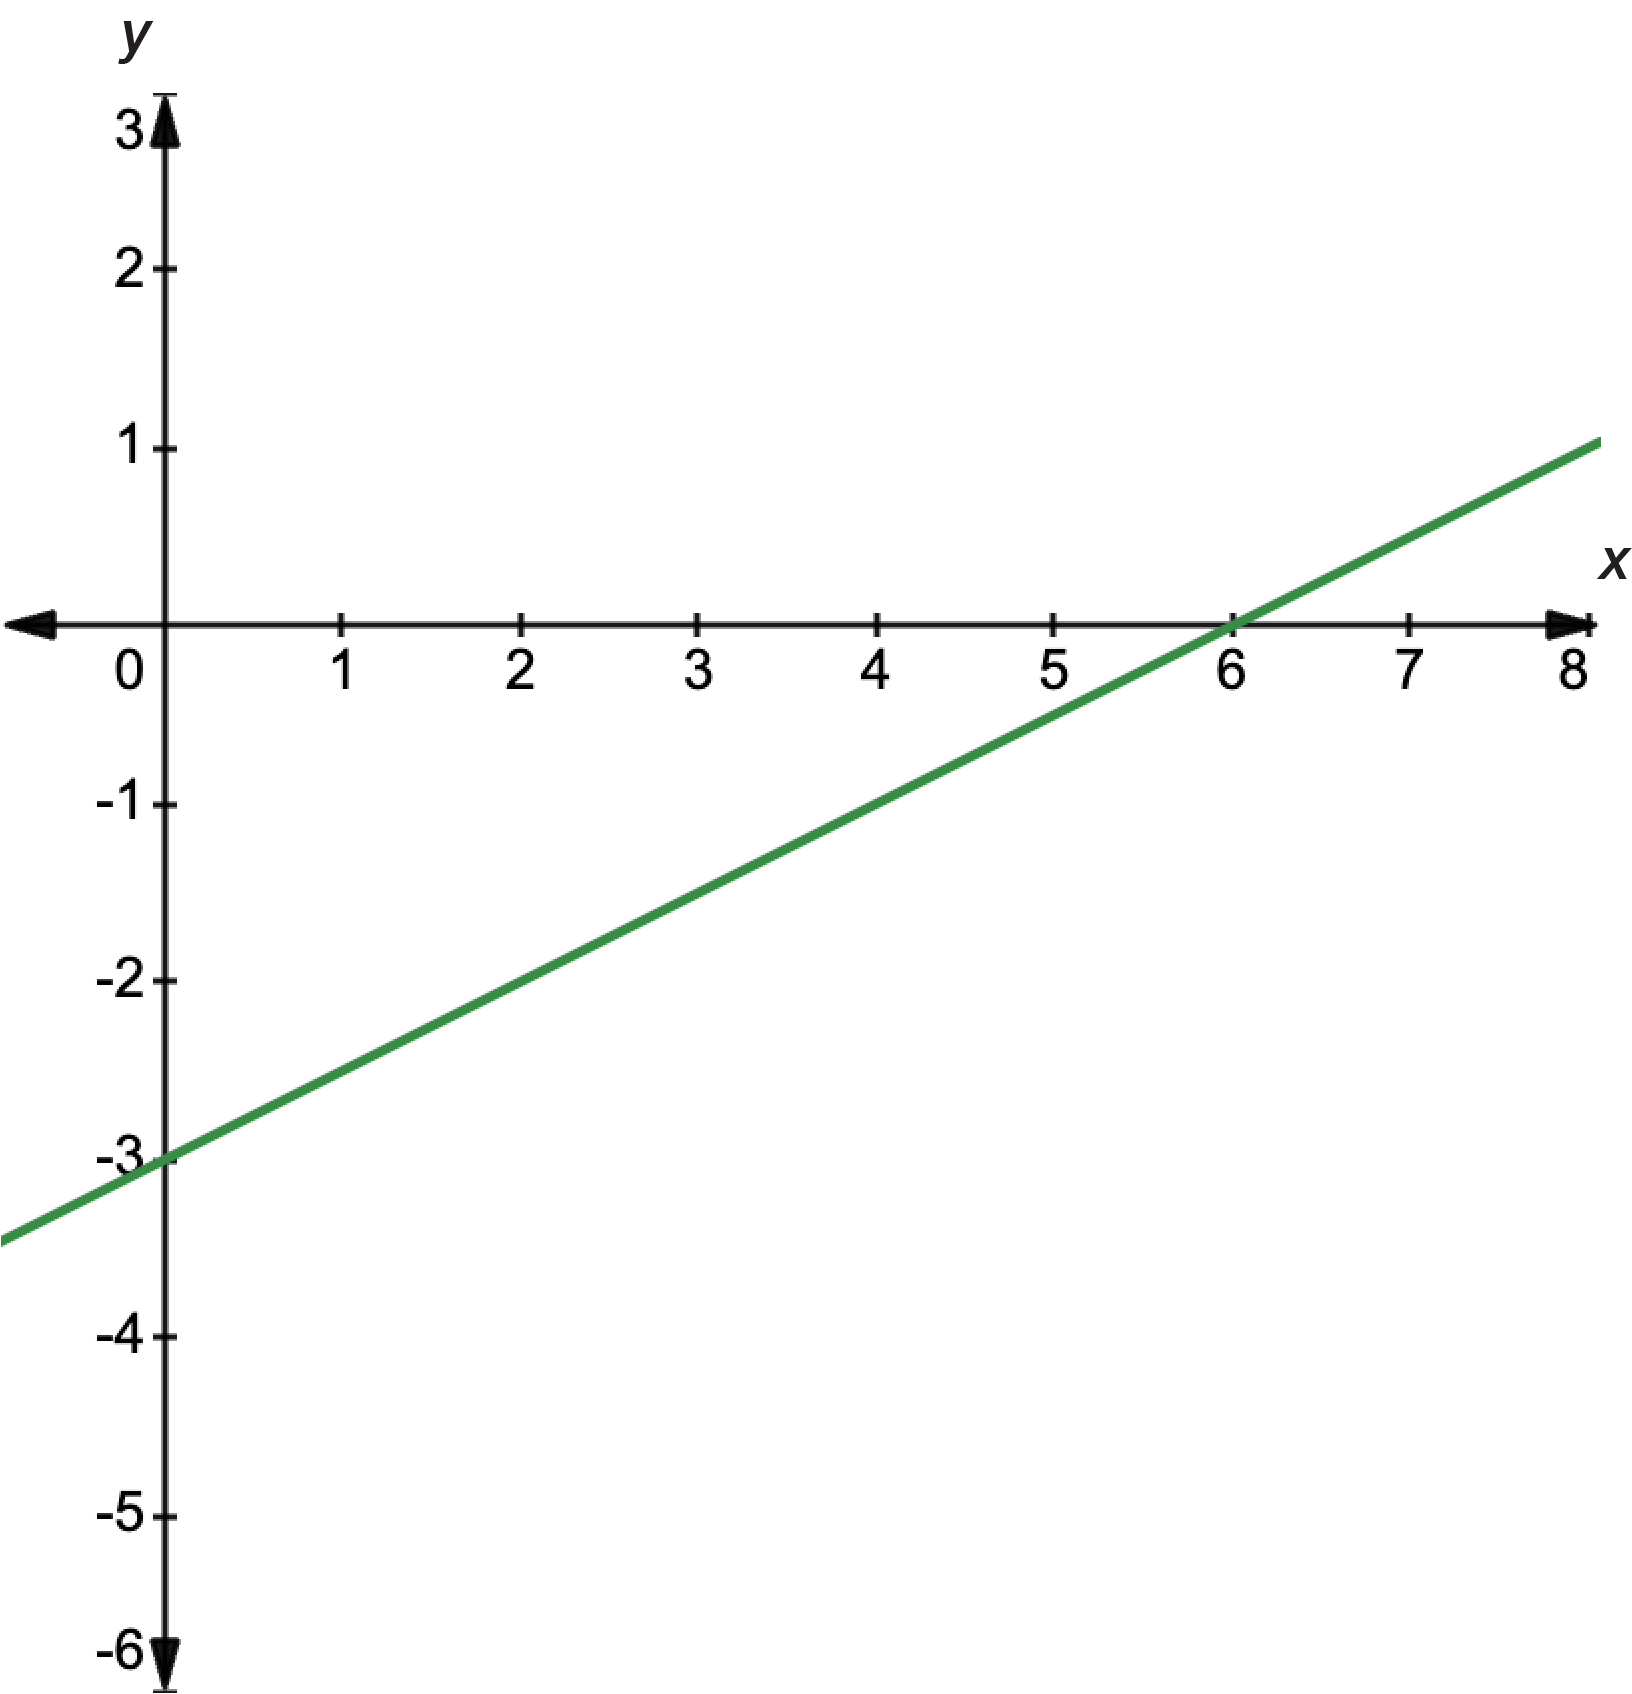
Sketch the function \(2y=x-6\) and find the gradient of the straight line.
To sketch the graph, we can find the \(x\)- and \(y\)-intercepts.
For the \(x\)-intercept, let \(y=0\):
\[\begin{align*} 2y & = x-6\\
2(0) & = x-6\\
0 & = x-6\\
x & = 6
\end{align*}\]
Therefore, the \(x\)-intercept is at \((6,0)\).
For the \(y\)-intercept, let \(x=0\):
\[\begin{align*} 2y & = x-6\\
2y & = (0)-6\\
y & = \frac{-6}{2}\\
& = -3
\end{align*}\]
Therefore, the \(y\)-intercept is at \((0,-3)\).
We can sketch the graph by indicating these points on the axes and drawing a straight line through them.
To find the gradient, let \((x_{1},y_{1})=(6,0)\) and \((x_{2},y_{2})=(0,-3)\).
\[\begin{align*} m & = \frac{y_{2}-y_{1}}{x_{2}-x_{1}}\\
& = \frac{0-(-3)}{6-0}\\
& = \frac{3}{6}\\
& = \frac{1}{2}
\end{align*}\]
Since we already know the \(y\)-intercept is at \((0,-3)\), \(c=-3\). Therefore, the equation of the line is \(y=\dfrac{1}{2}-3\).
Again, we can get rid of the fraction by multiplying both sides by \(2\) to give \(2y=x-6\) or \(2y-x=-6\).
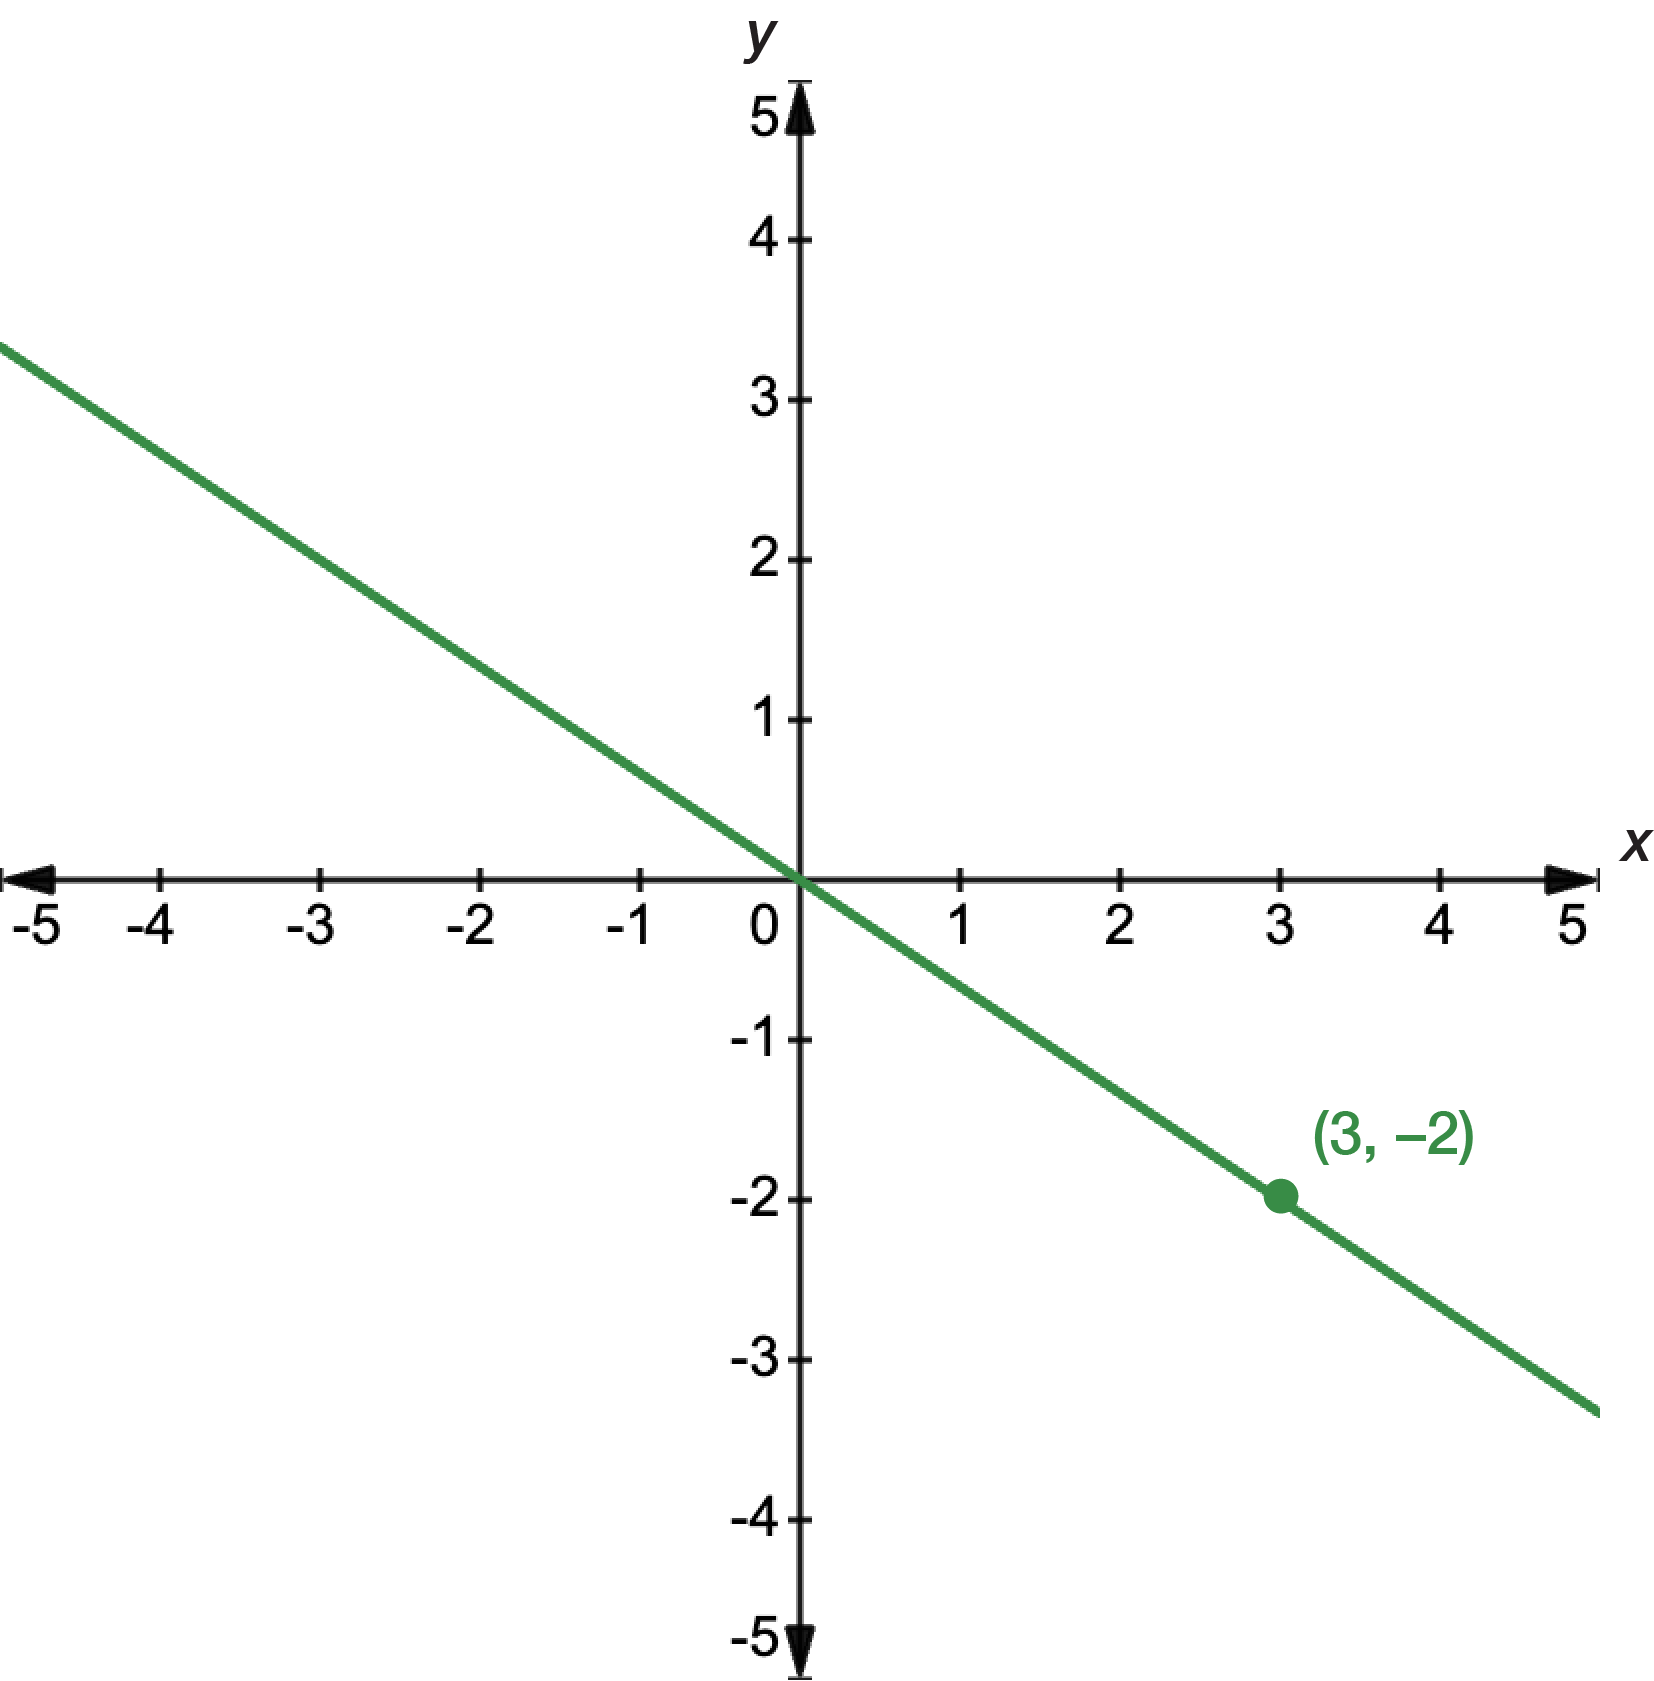
Sketch the function \(3y+2x=0\) and find the gradient of the straight line.
Find the intercepts. For the \(x\)-intercept, let \(y=0\):
\[\begin{align*} 3(0)+2x & = 0\\
2x & = 0\\
x & = 0
\end{align*}\]
For the \(y\)-intercept, let \(x=0\):
\[\begin{align*} 3y+2(x) & = 0\\
3y & = 0\\
y & = 0
\end{align*}\]
This means that the function passes through the origin \((0,0)\). Another way to tell this is by converting the equation into the form \(y=mx+c\).
\[\begin{align*} 3y+2x & = 0\\
3y & = -2x\\
y & = -\frac{2}{3}x
\end{align*}\]
\(c=0\) so the \(y\)-intercept is at \(0\).
To sketch the graph, we need another point. We can pick any value for \(x\) except for \(0\). As an example, let's pick \(x=3\).
\[\begin{align*} 3y+2x & = 0\\
3y+2(3) & = 0\\
3y+6 & = 0\\
3y & = -6\\
y & = -2
\end{align*}\]
Therefore, the point is \((3,-2)\). We can plot \((0,0)\) and \((3,-2)\) on the graph.
To find the gradient, rearrange the equation to the form \(y=mx+c\). We have already done this to get \(y=-\dfrac{2}{3}x\), so \(m=-\dfrac{2}{3}\).
Find the equation of the line that passes through the points \((-1,3)\) and \((2,0)\).
Let \((x_{1},y_{1})=(-1,3)\) and \((x_{2},y_{2})=(2,0)\).
\[\begin{align*} m & = \frac{y_{2}-y_{1}}{x_{2}-x_{1}}\\
& = \frac{0-3}{2-(-1)}\\
& = \frac{-3}{3}\\
& = -1
\end{align*}\]
To find the equation of the line, substitute \(m=-1\) and a point on the line into \(y=mx+c\). Either is fine but we'll use \((-1,3)\).
\[\begin{align*} y & = mx+c\\
3 & = (-1)(-1)+c\\
3 & = 1+c\\
c & = 2
\end{align*}\]
The equation of the line is \(y=-x+2\).
Find the equation of the line that passes through the point \((3,4)\) and is parallel to the line \(y=-2x+7\). Give your answer in point—slope form.
If the line is parallel, it must have the same gradient, so \(m=-2\). We can plug this and \((x_{1},y_{1})=(3,4)\) into the point—slope form:
\[\begin{align*} y-y_{1} & = m(x-x_{1})\\
y-4 & = -2(x-3)\\
y-4 & = -2x+6\\
y & = -2x+10
\end{align*}\]
Exercise – finding the equation of a line
Find the equations of the following straight lines.
Graph 1
Graph 2
Find the equation of the line with a gradient of \(3\), passing through the point \((0,-5)\).